What's the scenario:
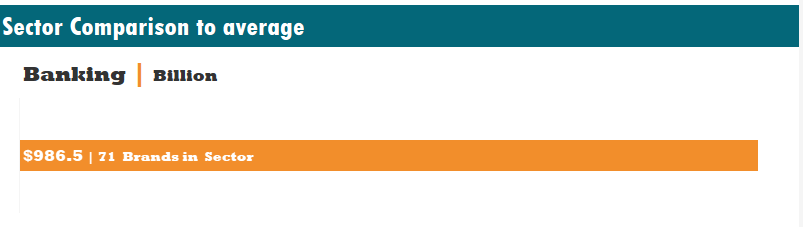
You want to compare your categorical values with the average value of all, and the line should remain consistent with yearly and categorical filters.
The Resoulution:
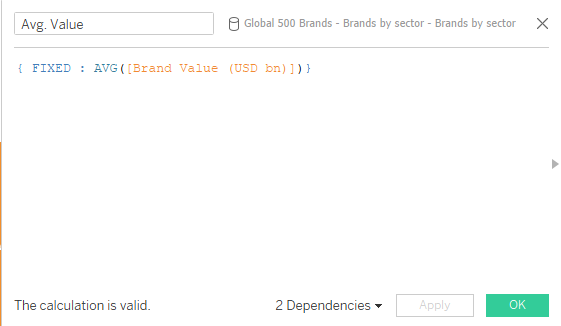
Step 1: Create a calculated field to fix your average measure across all categories.
Step 2: Create a dual-axis chart and change the chart type to Gantt. By synchronizing, you will have a comparable line chart alongside your bar chart. In this method, if you select one bar from all or a specific year, the average line will not change and will adhere to Tableau's order of operations, including Level of Detail expressions. By changing the line color, text, and size, you can easily customize the line over the bar chart.
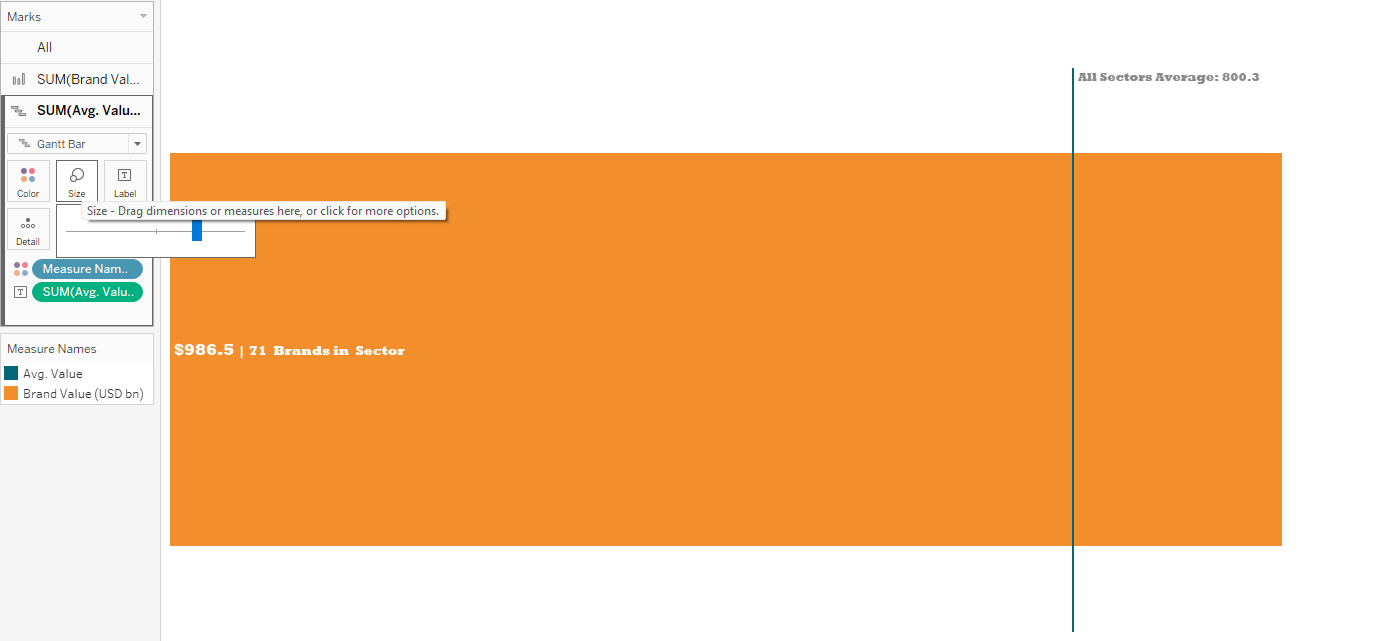
Note: You might wonder why I haven't used reference lines in the analytical pane in Tableau. The reason is that by selecting a specific year or categorical data, you would lose the overall average or calculation, and you would see the values at the level you've filtered. This happens because reference lines are at the bottom of the operation level in Tableau.
I hope you enjoyed the blog. Thanks for reading it!