


The goal of my personal project was to identify areas where cycling mostly happens in Hamburg. It is strongly inspired from an already existing concept of the city of Hamburg which does the same for pedestrians ("Bedeutungsräume für Fußgänger"). I explored those areas with data for the year 2024 of the bike rental service DB Rad+.
Before I arrived at this point had a look at several other datasets which count the amount cyclists at certain points in Hamburg via infrared cameras - very fancy, very advanced but sadly not usable for me in the given timeframe. It was a shame since data there are created countinously around the clock so the picture would have been very good.
Anyway, I chose DB Rad+ since this dataset already has route data which I could readily use. I would have liked to include more years and datasets from another rental service called Stadtradeln but again those would certainly have extended the workload outside of set timeframe.
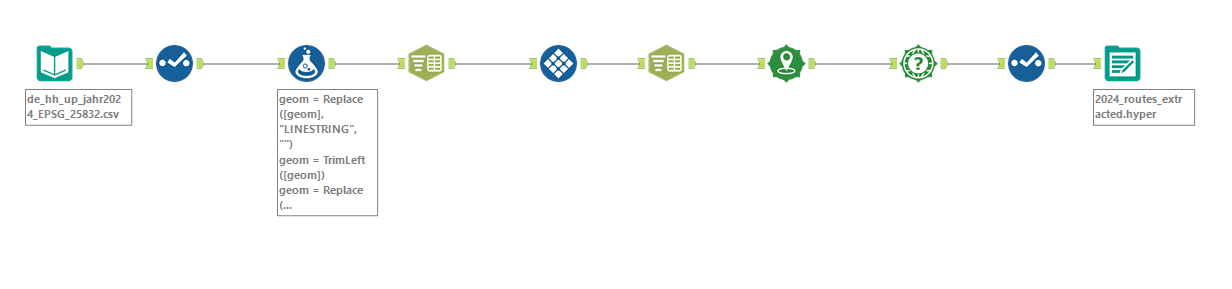
I transformed the data of DB Rad+ with Alteryx to make them applicable in Tableau; basically I:
- parsed coordinates
- cleaned the newly created field of unnecessary contents like text and trailing whitespaces
- created a new row for every new segment of a tour
- added a path ID to each segment in order to know which order these segements build up to a complete tour
- separated start- and endpoint coordinates frome each other into their own columns for each tour segment
- converted the coordinates into Tableau standard.
Afterwards I loaded the data into Tableau and began exploring. The dataset included only two measures which are the amount of cyclists per route and the speed per route.
It became clear that visually mapping, filtering and aggregating would be the main part to identify significant cycling areas in Hamburg. Here for example you can see the main routes per cyclist volume in Hamburg:
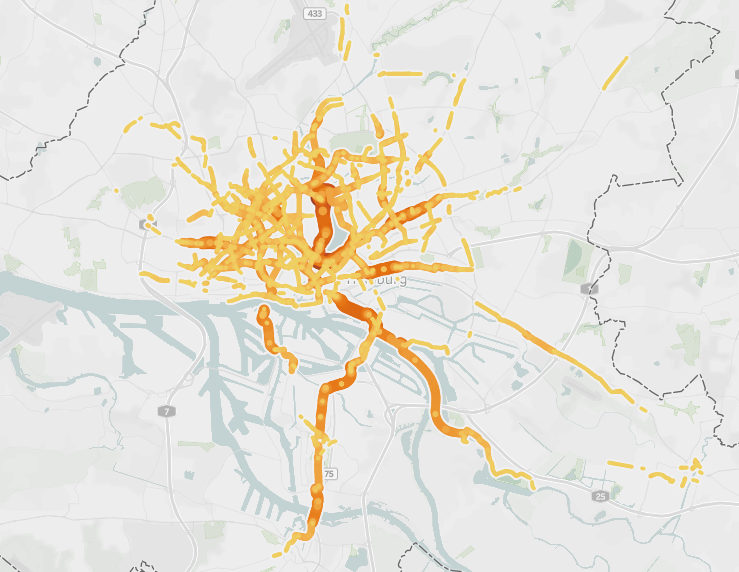
Also, feel free to have a look at the whole dashboard and twiddle around as you like.