I was given the task in the morning and it was to use the Federal Infrastructure Projects dataset to create a dashboard and present it in the afternoon.
The Plan was to understand and clean the data and also to draw a sketch until midday. After the Lunch Break I am supposed to start building the dashboard and practice the presentation before 4 pm. The data was a bit complicated to understand and it had a lot of missing data but there was not so much cleaning to do.
I achieved the below sketch:
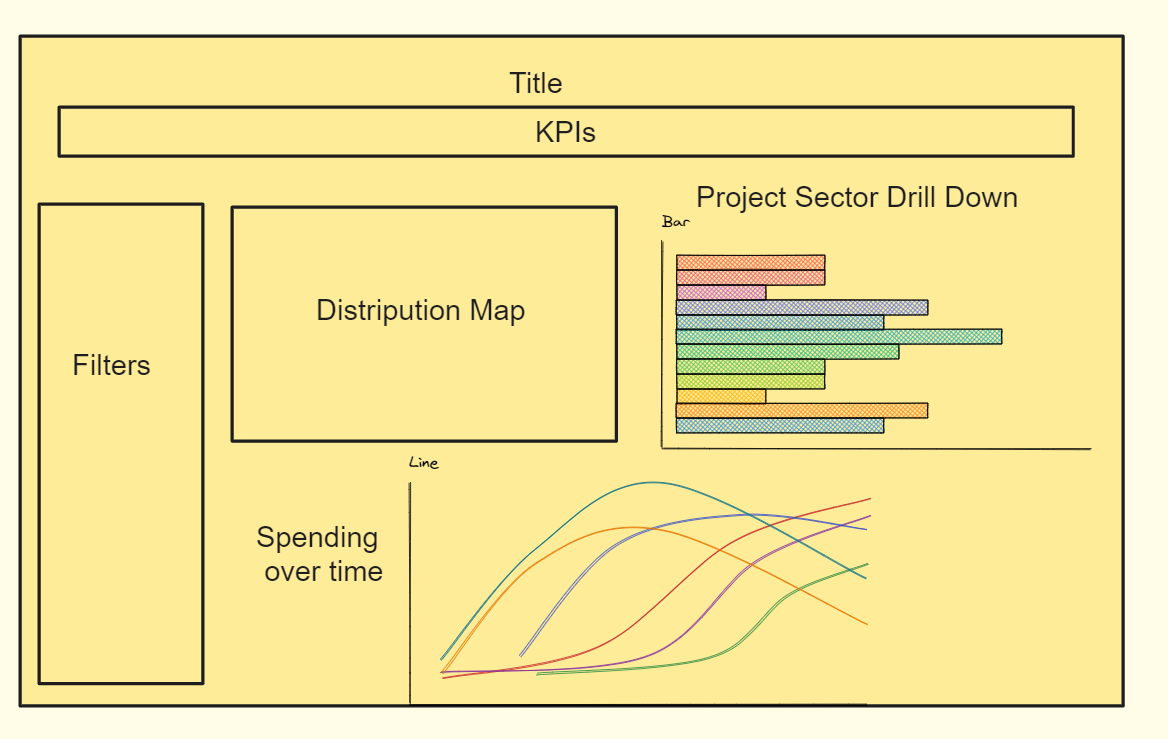
unfortunately I could not implement all the graphs I decided to do in the sketch due to a lot of missing data especially the costs column.
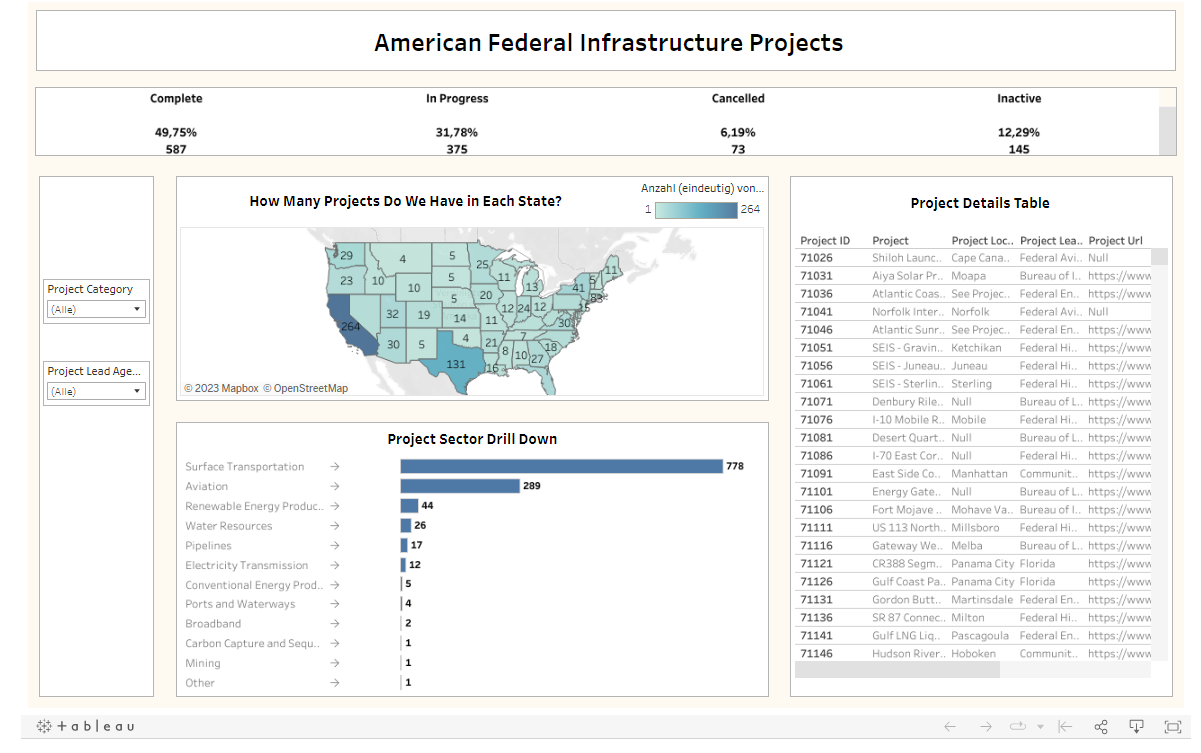
I made a slight change and achieved the below dashboard by 04 pm. The screen shot would seem a bit different from the the dashboard in the link because it was editted later.