The fourth day of dashboard week was quite similar to the third, with less than a full day available to us. Many of us had important commitments, which is why we only started close to midday.
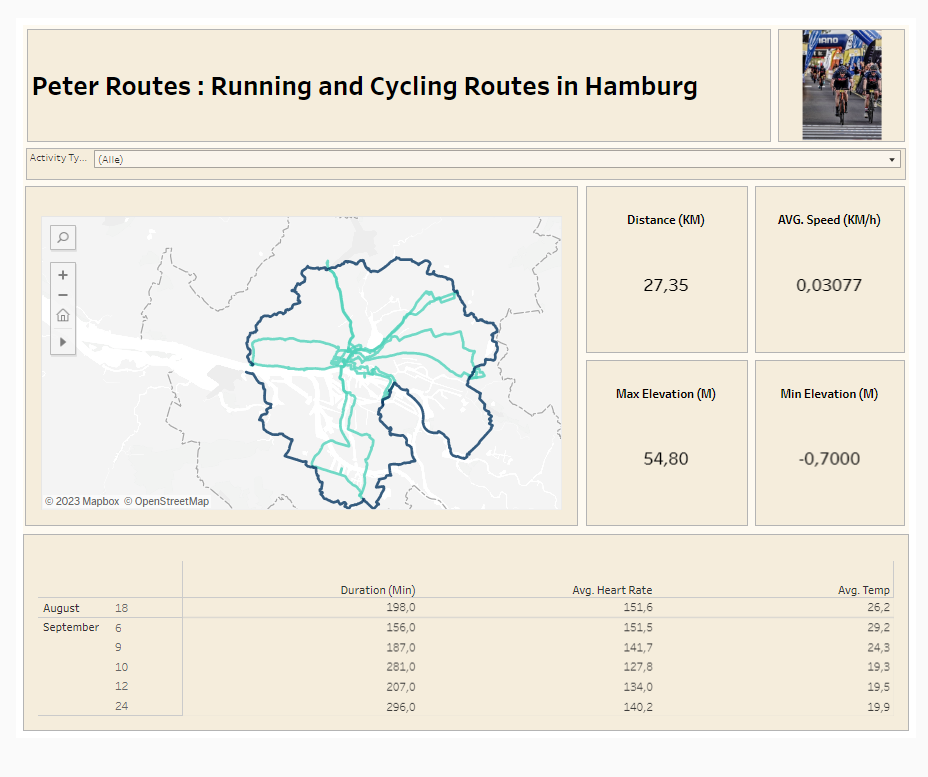
The topic for the day was interesting. We worked with a GPS dataset obtained from a sports challenge named "Run The Ring." The challenge involves running and cycling specific routes in and around Hamburg.
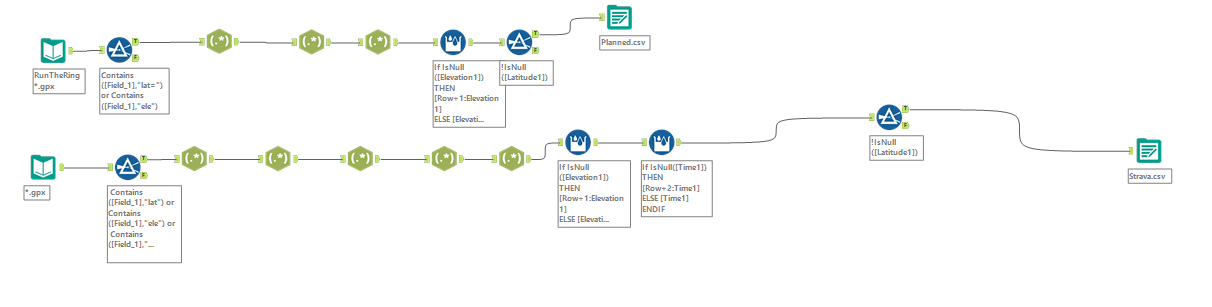
Initially, we needed to clean the data and merge all the files. This process consumed a significant portion of our planned time for the day. I used Alteryx for this task. I enjoy working with Alteryx, so preparing and cleaning the data was an engaging experience. Given that it's GPS-derived data, I primarily used regex to extract the necessary information. Ultimately, the results I achieved were closely aligned with the trainer's outcomes. It was then important to transform the routes into spatial data within Alteryx using spatial tools.
The primary objective was to construct a Tableau dashboard to visualize the routes. I had roughly 90 minutes to accomplish this. As anticipated, I couldn't fully realize my vision within that timeframe, but I came close. After the presentation, I spent some additional time refining the dashboard and made a few enhancements to improve its appearance.