Hi :)
I can’t believe this is already our last week of training — which means this week is basically all about building dashboards. During the past couple of weeks, we had a few hours each week to work on a personal project, and since we’re also having a viz contest right now, we decided to combine both. Today we finally presented our results.
My original idea was to analyse reading habits across different countries. I actually wanted to do this already when I was creating my first application dashboard for TIL, but I ran into the same issue back then — I just couldn’t find a dataset that would allow me to answer all the questions I had in mind. The same happened again now, so a few days ago I decided to switch topics to avoid wasting more time.
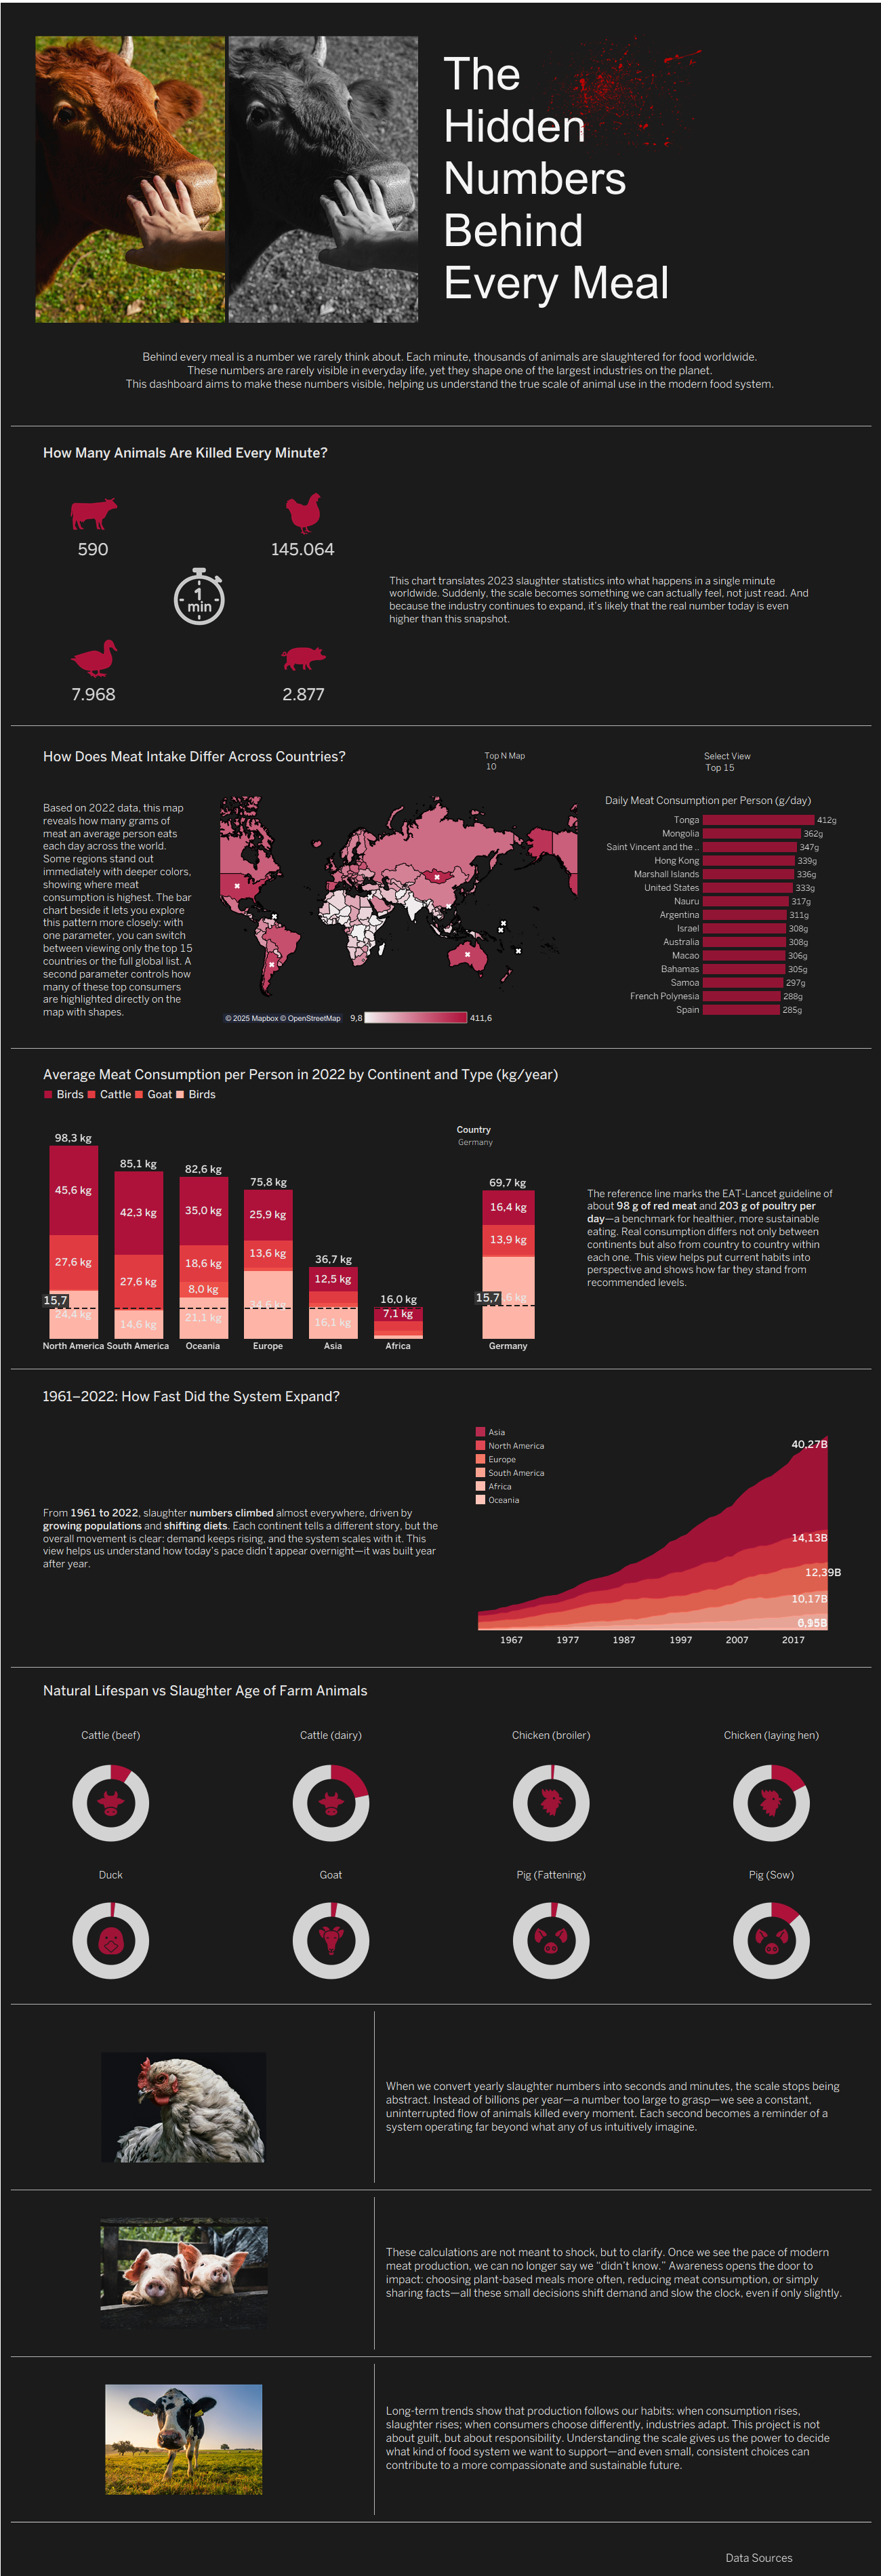
I ended up choosing a topic that’s very important (and emotional) for me: the slaughter of animals for meat production. A few years ago, learning more about this made me rethink my own food choices. With this dashboard, my goal wasn’t to shock anyone — I just wanted to show the scale of what’s happening and maybe encourage a small step toward more mindful choices.
Switching topics last minute definitely added some extra stress, but in the end I’m really happy with the direction I chose. While building the dashboard, I came across so many interesting insights. And of course, I now have even more ideas for the future — for example, a “what-if” scenario where users can choose a reduced amount of meat consumption and instantly see how many animal lives would be saved. I’d need an additional dataset for that, but it would be such a fun feature to add later.
Have a look at my results! 😊