


DSNY9 and I had the pleasure to have learned Tableau Next yesterday. So todays objective? Recreate our Real World, Fake Data Dashboards all the way back from Week 5.
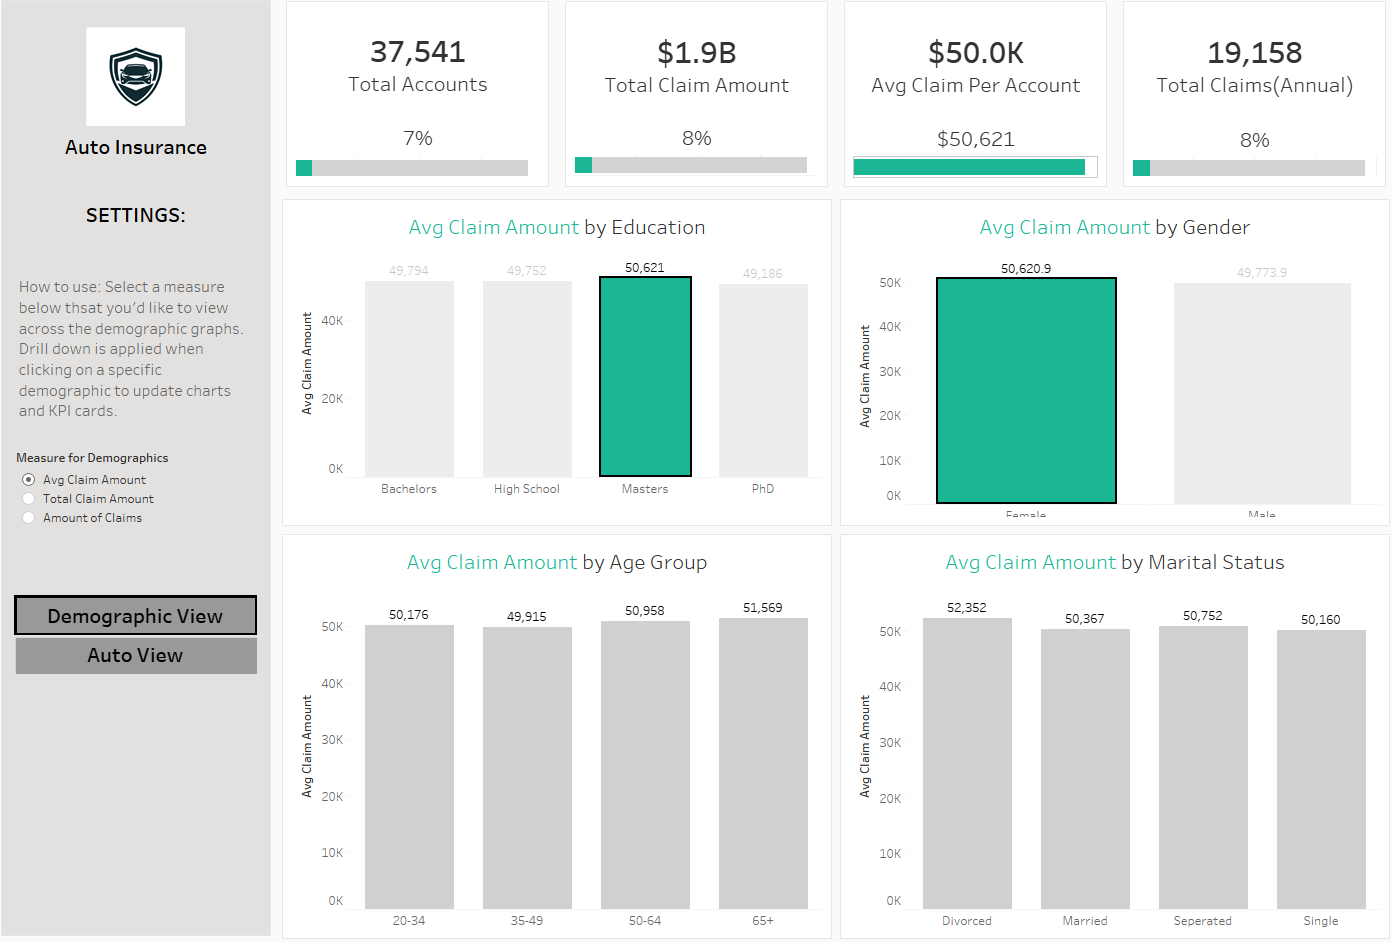
Here are a few snapshots to paint a better picture of what I will be recreating!
Now into Tableau Next. There are a few limitations and bugs with Tableau Next that we encounter on the way. My first impression of the dashboard was to recreate that home page into a much more condensed chart. This includes making not only the measure dynamic but also the dimension. That is this picture below.
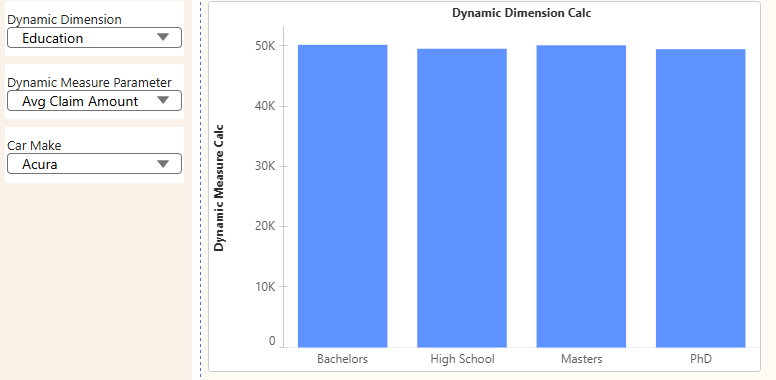
This part didn't bring too many issues. Some notable ones was that almost all calculations had to be built in the semantic models part of Next. Making a parameter calculation inside of the visualization section does not work because you cant reference the parameter.
Since we bundled up all of those original charts, next was the KPI cards. The big limitation here is that you cant size the individual text of a number like you can in desktop so the result looks a little like this:
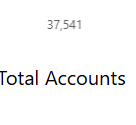
So lets scrap those and we will have to incorporate a different way to show KPI's
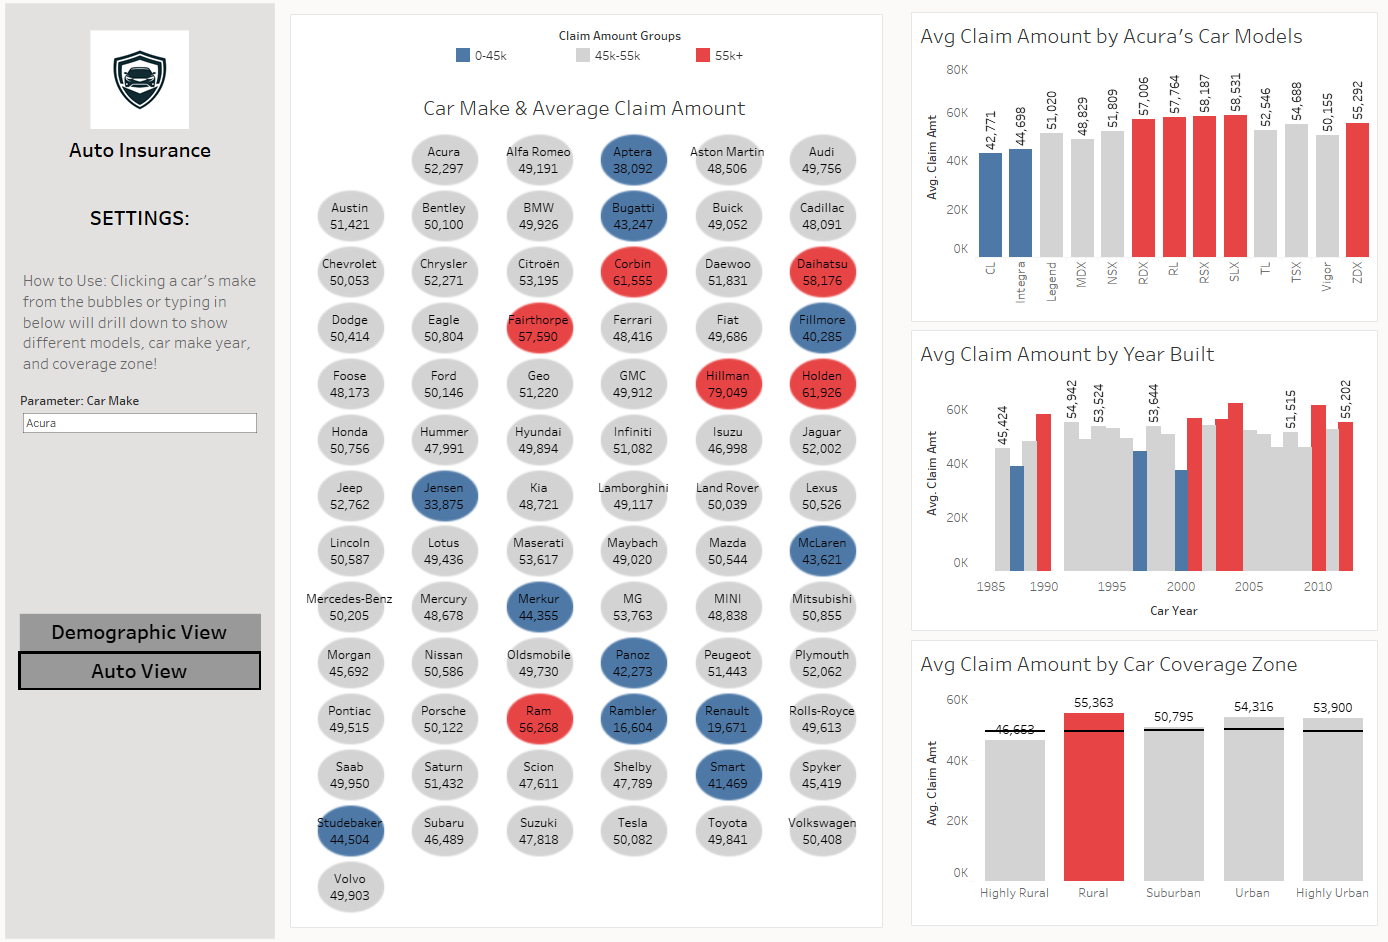
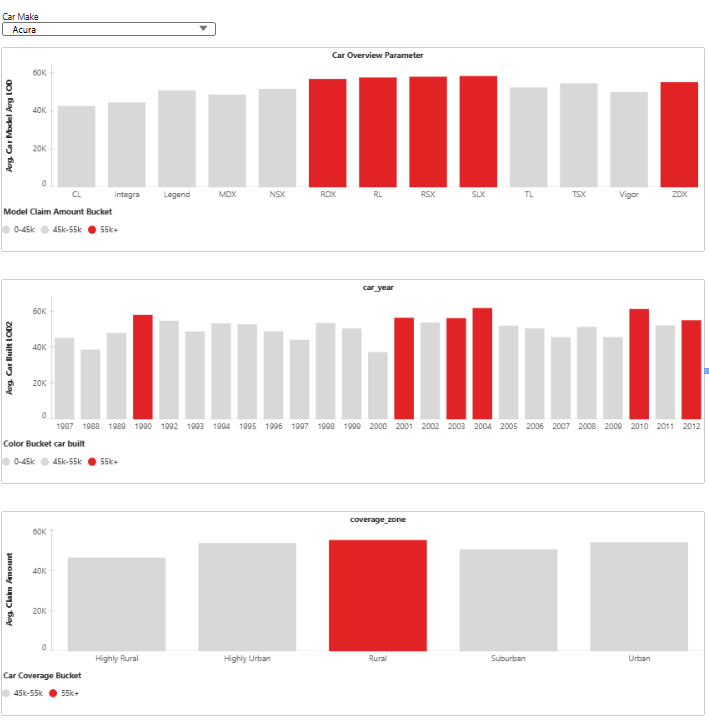
Next up was the line up of the different charts in the auto view. When originally looking at this, I wanted to do what I did for the Demographics overview. Unfortunately each of the charts had to use different measures so I wasn't able to combine them. They turned out to look like this!
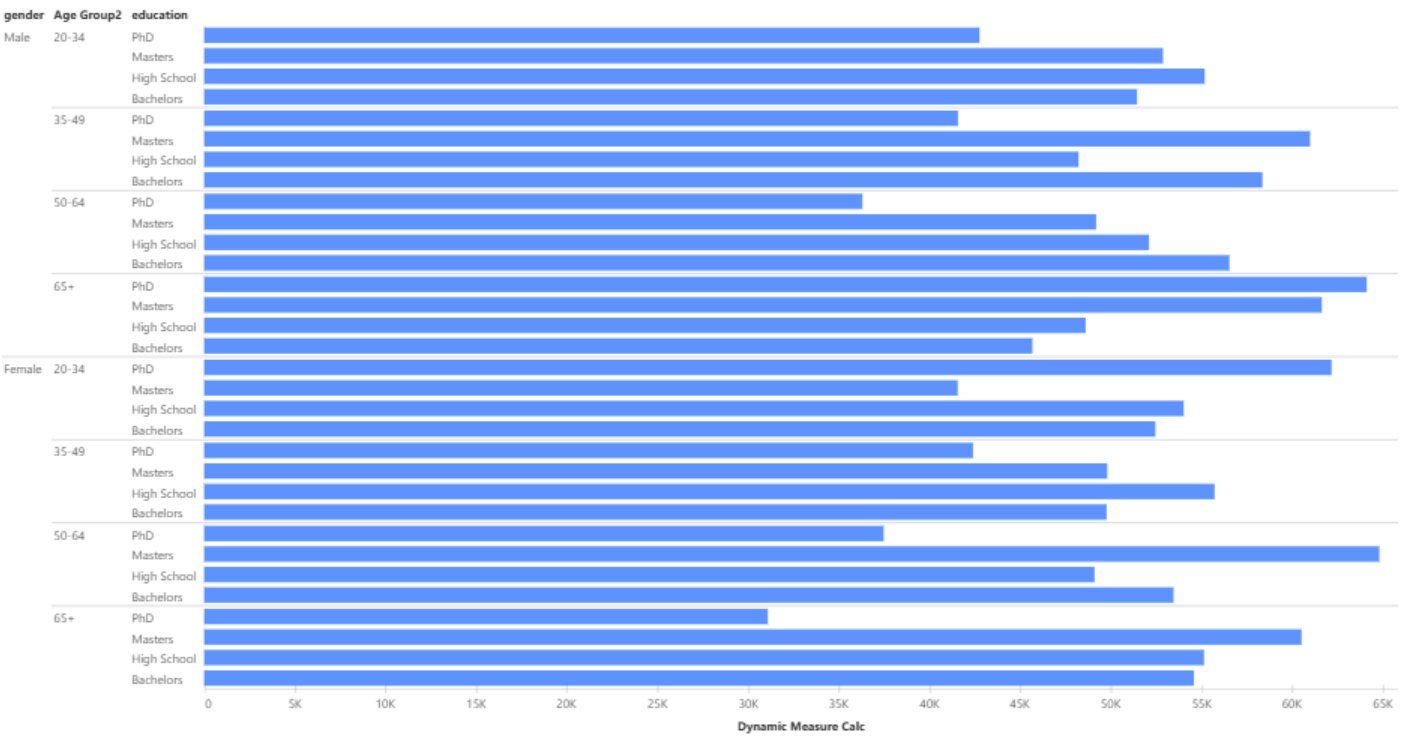
Following these I wanted to incorporate some kind of table that helps the user break down certain categories based on the car make or model.
All in all those will be what will make up the new Tableau Next Dashboard. And the final product looks like this:
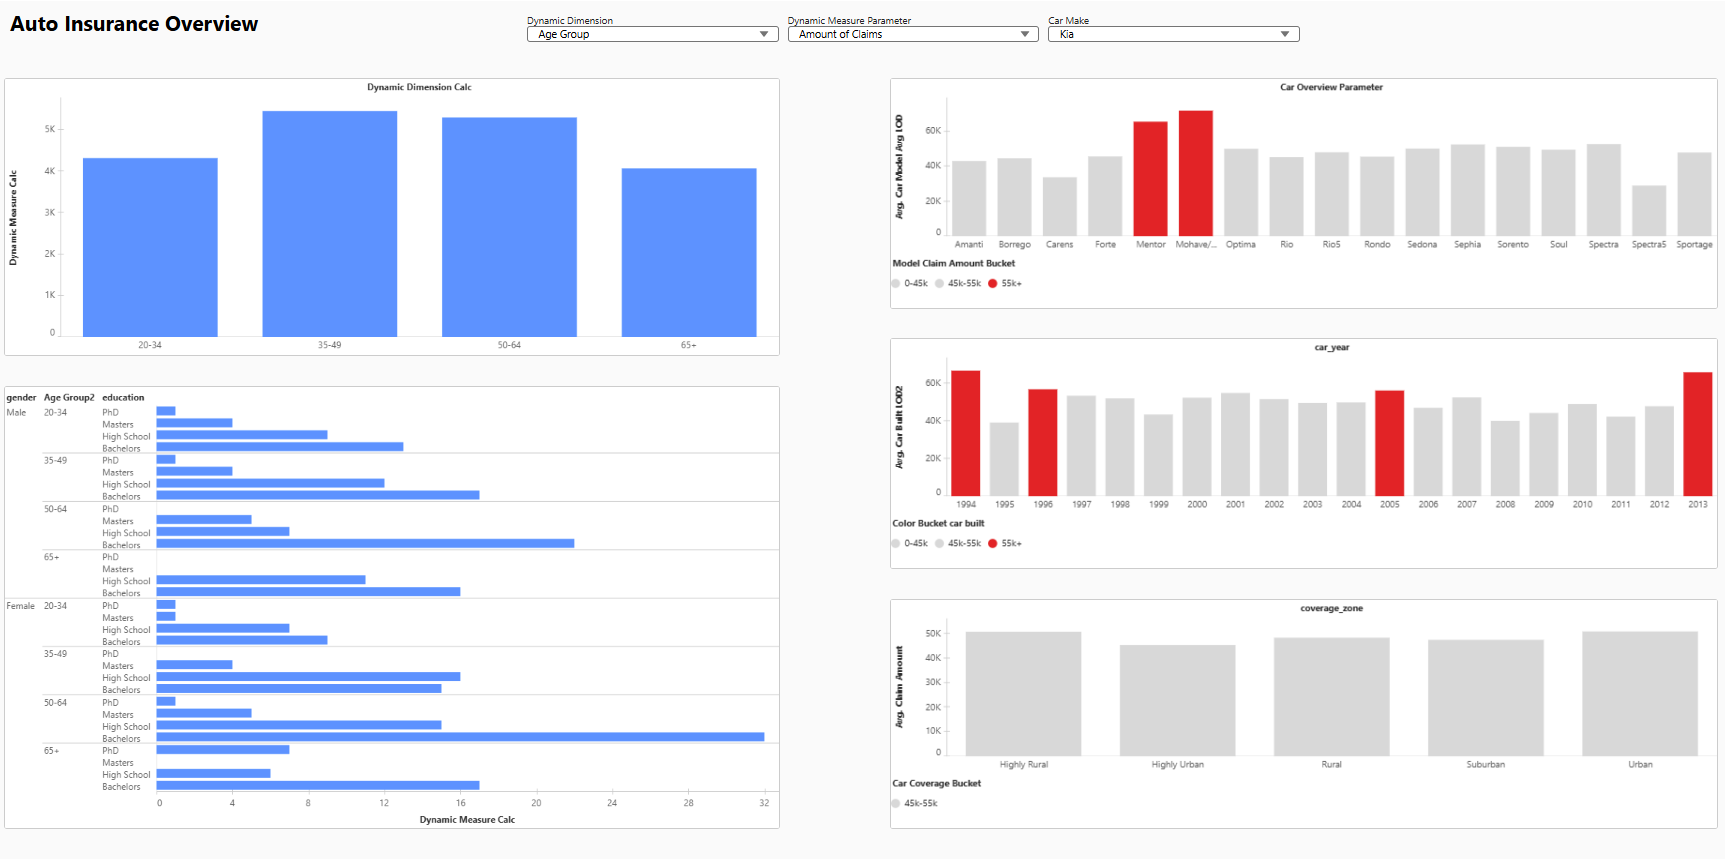
Reflection: Coming from the original dashboard I had a lot of dashboard actions that included sets. This is unfortunately not available yet in Next so I lost a lot of functionality. Also above I have the Car Make table and that is because of some indexed column and row fields. When trying to incorporate those into the Next environment I was unable to change the specifications needed to detail out all of the car brands. Within the parameters you are now unable to get a list based off of a field so that can get tedious to type out everything depending on the list.
Things I liked about Next was the layout functionality, although slow, it doesn't deal much with containers and gives you a grid-like drag and drop scenario. There is a nice make table view which is something Tableau wasn't market strong in before and makes it a better experience with tables.