


Today we worked on our project with our own data from Spotify.
Below you can see what I did.
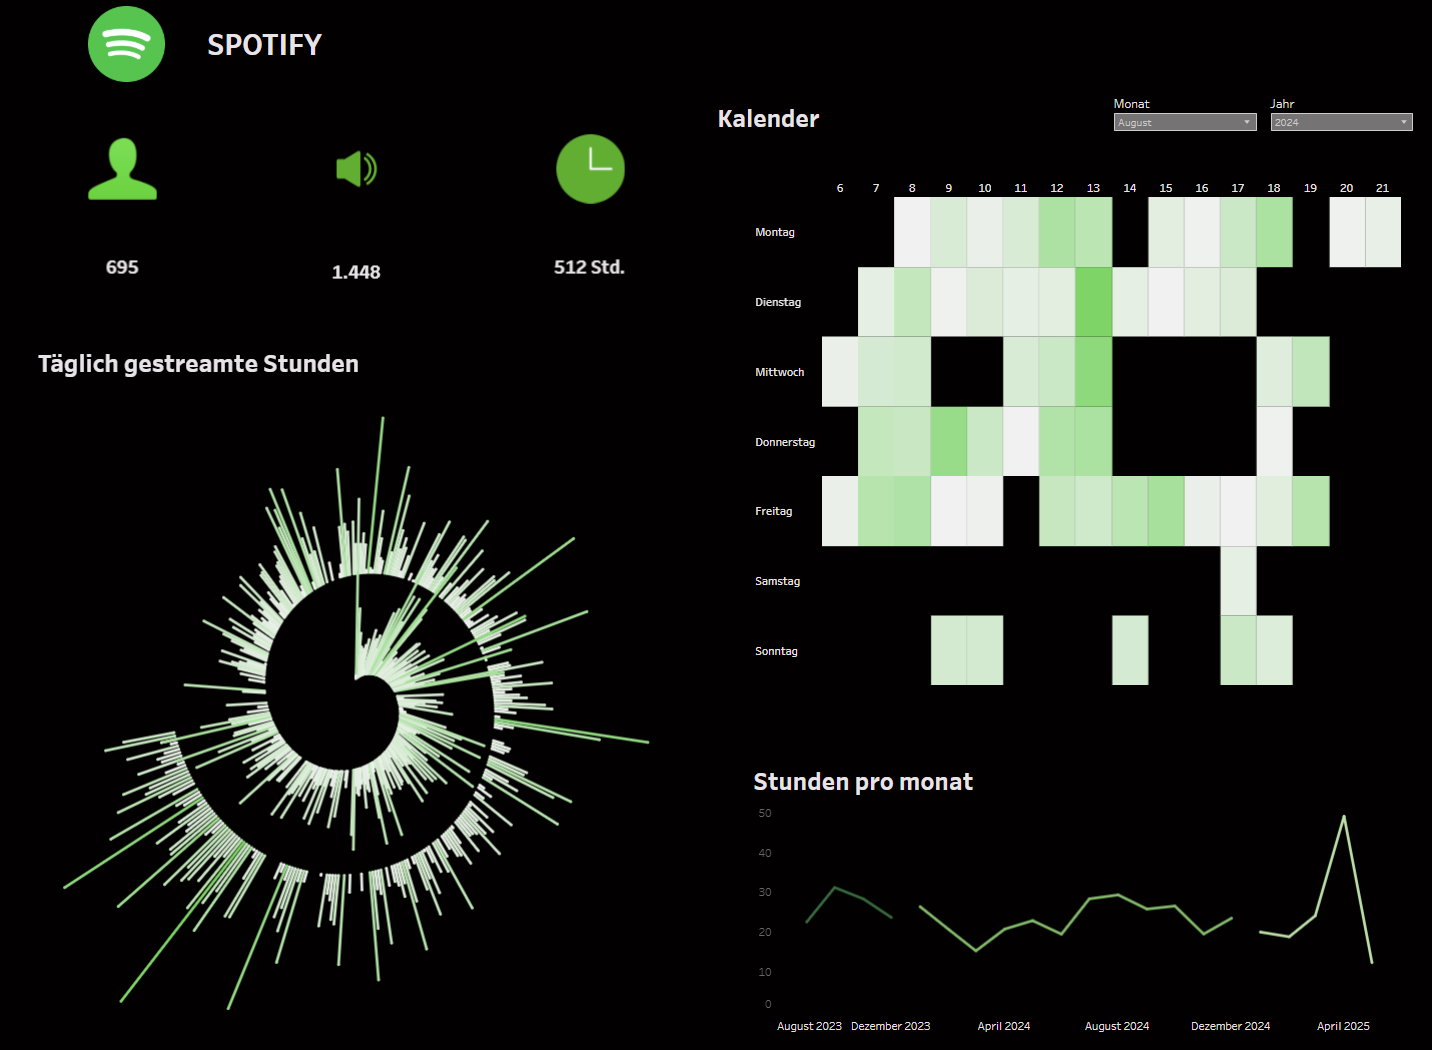
Today I had 2 challenges while doing this dashboard:
- First one was to figure out how to do this spiral chart (I think next time I will write a blog about this topic😃).
- The second was converting milliseconds to hours — I used Google and a simple calculation. 😄
Also, what I learned is: don't just repeat what somebody did — it's better to watch a video or read documentation and understand how to build it.