


Our challenge for the first day of dashboard week was to recreate a visualization we had done in Tableau Desktop in Tableau next.
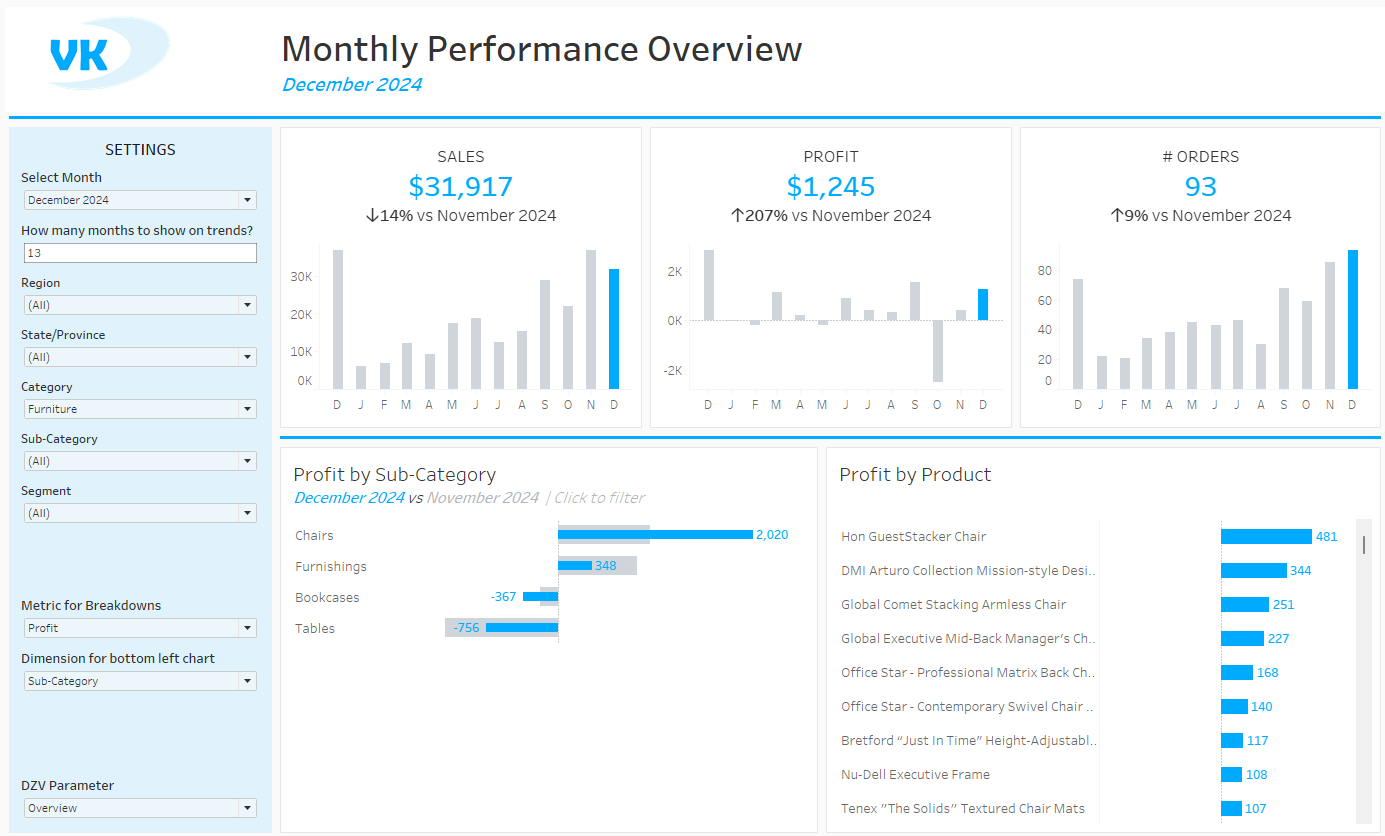
This dashboard was focused on month-over-month comparisons, dynamic zone visibility, and filter actions.
From my experience trying to recreate this dashboard, the uses of Tableau and Tableau Next are very different.
One of the things that translated easily was my dynamic measure selection.
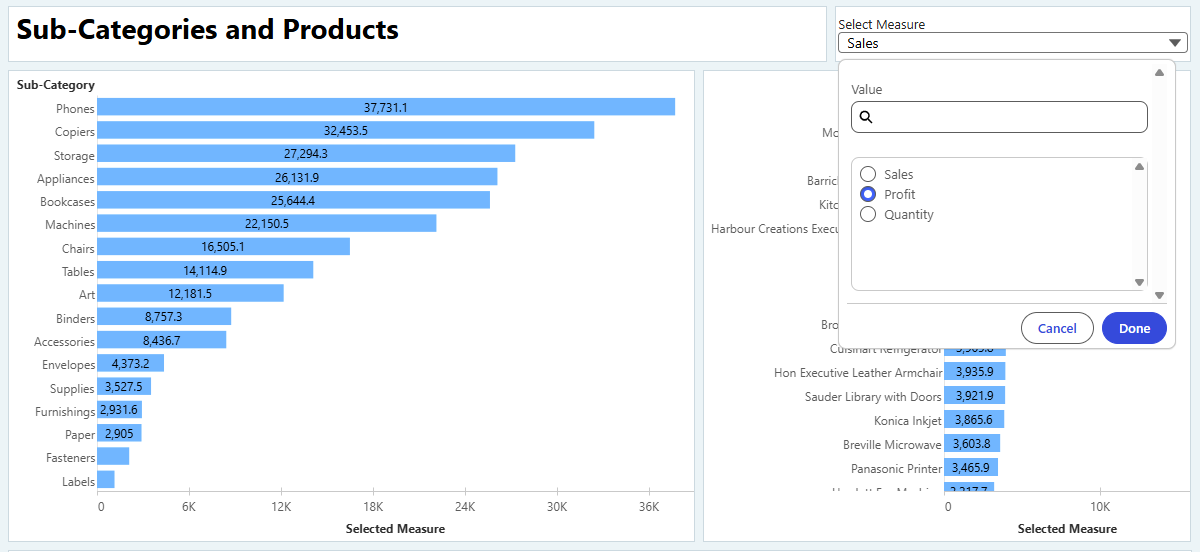
As someone with desktop experience, I found that this was the most 1:1 recreation I was able to do.
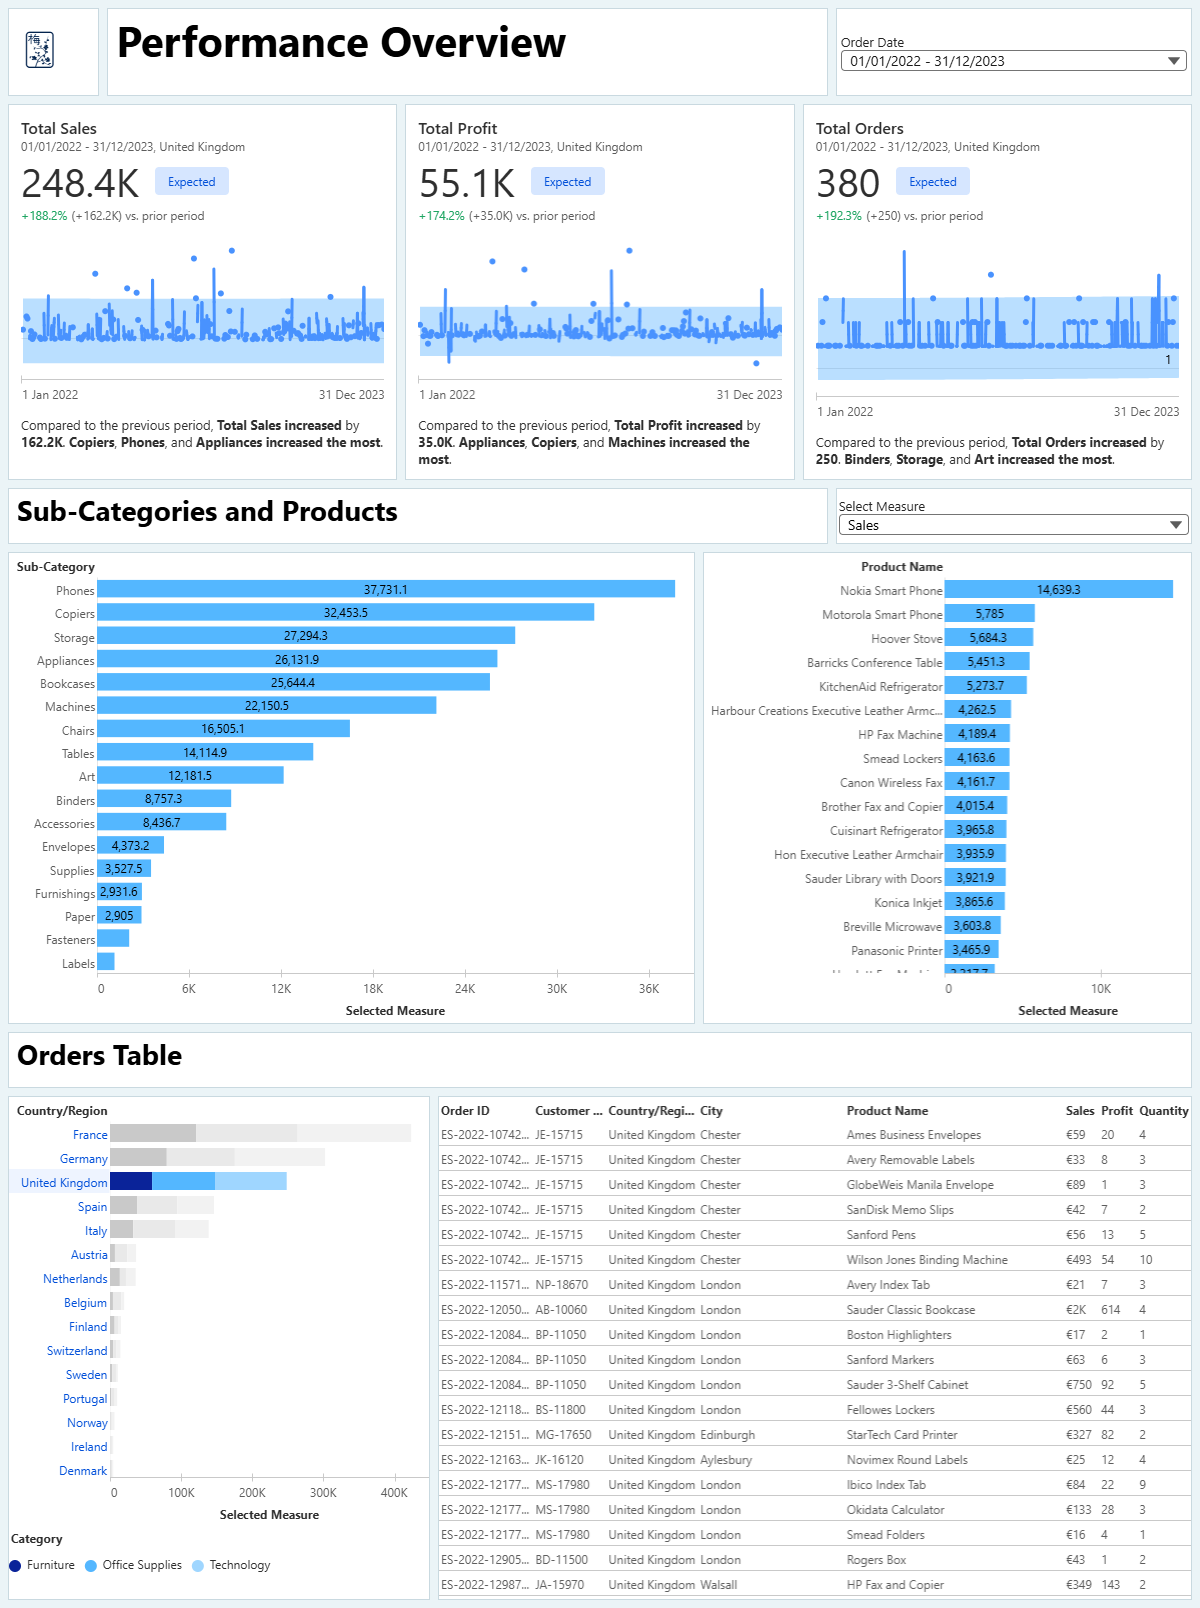
I think that one of Tableau Next's strengths is using Metrics. These make excellent pre-built KPI cards with natural language insights. However, it was difficult to align the formatting and visuals to what I believed would be most useful.
The current aggregation for my Metrics is none. It is showing each order per day.
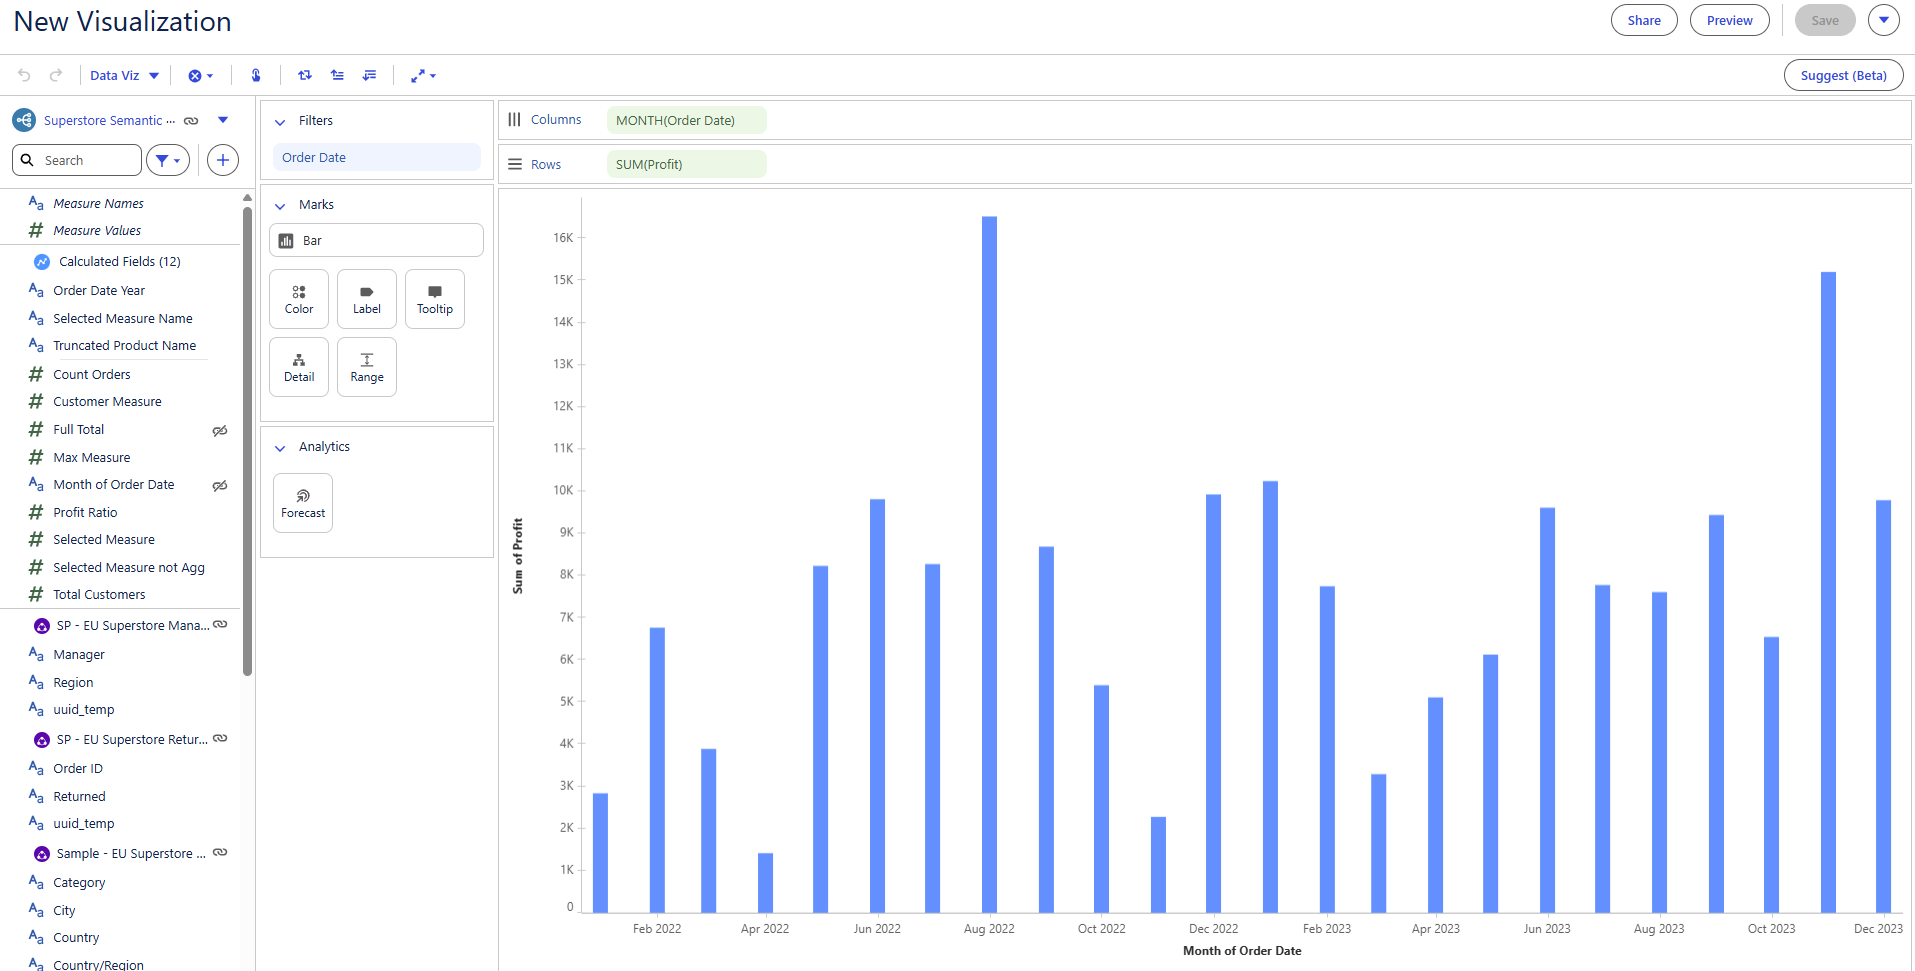
When previewing my metrics, I found that I could edit the visualizations provided (in my case, I wanted a bar per month) but was disappointed that these did not change the Metric cards. It just saved as an additional visualization.
Doing the month-over-month calculations I had in the original was also... very difficult. I has convinced me that the best uses are for live connections where data is being added often and the 'Past X Months' filtering that is built in to Next can be leveraged.
As I found myself fighting Tableau Next over the dates, I paused my direct recreation and tried to lean into Next's strengths instead.
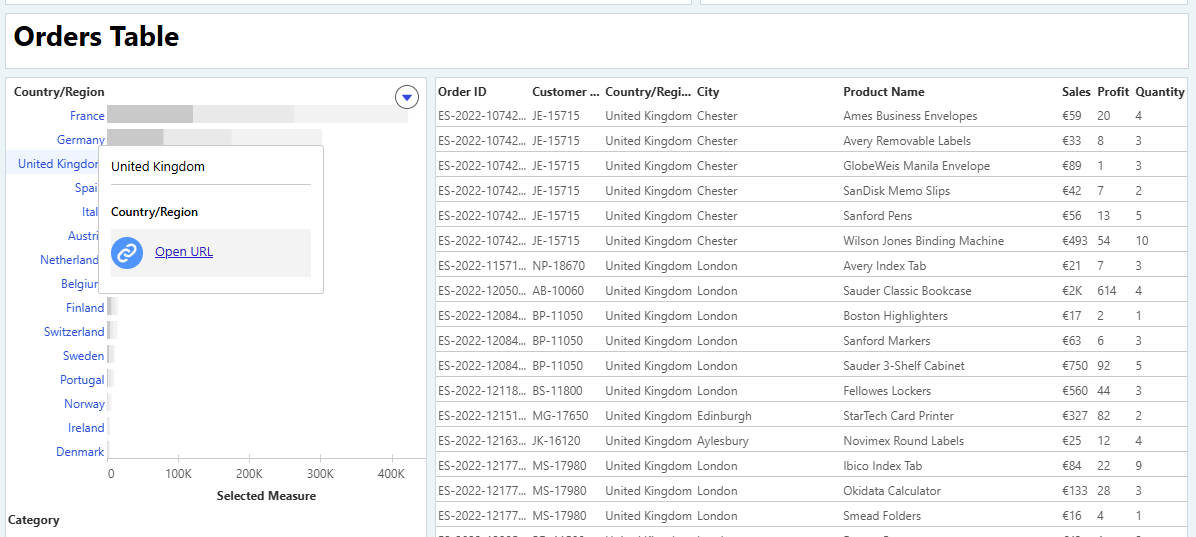
A small thing I enjoyed was using the Go-To-URL action to add a link to the wikipedia page for each country a user could select.
After this experience, my overwhelming impression is that Tableau Next is best for live data and simple visualizations. It can be a helpful tool for seeing an overview of what is going on, but lacks the features needed for a deeper analysis.