


Planning is the key to anything in the data school. Starting from your first application to planning for client project. This is a guide on how to plan your data preparation.
Understanding is key
Or as Carl would put it: Know your input (and know your output! )
So, you have received a data source - great! The first thing you do is to understand what's in front of you. Here are a couple of questions that are worth asking, before even thinking about prepping the data:
- What data type is each column?
- What information does each column actually contain?
- What is the range of values?
- What does each row represent? (Granularity)
Obviously, you need to also understand your output. Some questions for that could be:
- What is the data going to be used for?
- What are the key fields and why?
- What other information could be useful/valuable?
- What questions can the data answer and how?
- How many and which columns do we want at the end?
- How many rows are we expecting at the end?
That's a good start. If you don't have the answer to some of these questions it is worth asking someone, who can help you (or doing your own research). KNOWLEDGE IS KEY!
If you have been given several datasets, which you are meant to join this is a good approach to answering (some of) those questions:
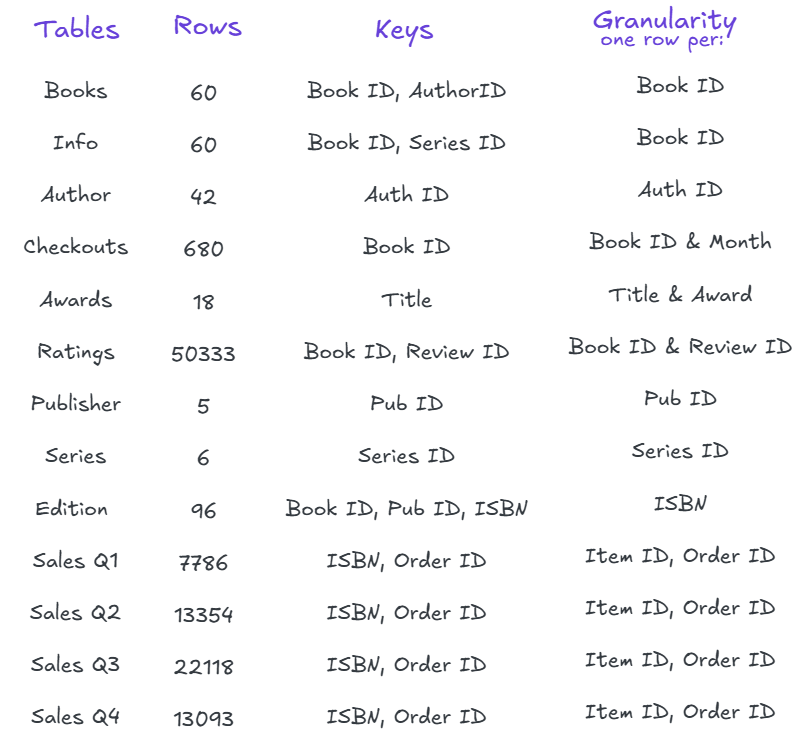
Under 'Tables' you list every table name you have been given.
Under 'Rows' you note down the number of rows each of these tables has. Why? That helps you to have an idea of what the size of your output is and it can help you understand the granularity. In this example we can see that Books and Info have the same amount of rows. This can be an indication that they have the same granularity and that they might be joined without a problem. (Careful: MIGHT)
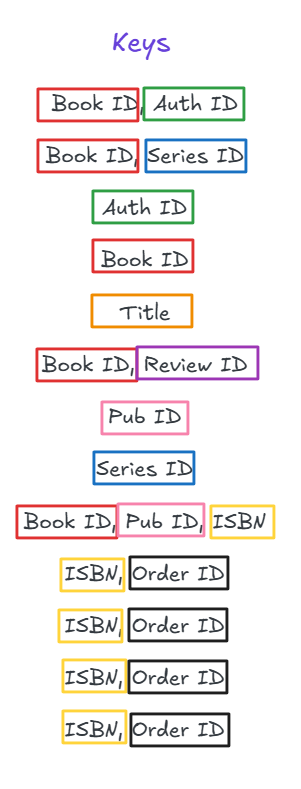
Under 'Keys' you note down any field names which seem like they could be relevant in other tables and therefore could be used to connect the tables together. This can be one or several fields.
Under 'Granularity' you note down what each row represents, meaning what makes each row unique.
This view gives us information to help us plan our prep:
- We will want to combine the sales data, meaning we have to look at how many rows well have overall: 56351
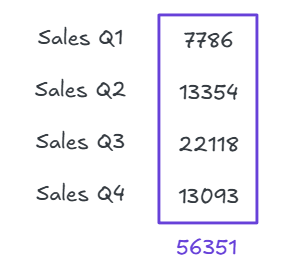
That is our Master row number, which we will want to stick to throughout the planning.
- The keys tell us how we can connect the tables and whether we need to create more fields.
Now you can connect it, step by step, always checking for the row count and the keys to help you to connect each table. Don't forget to constantly ask yourself what the granularity is (KNOW YOUR DATA).
The actual cleaning part of the data is obviously highly dependent on what it looks like and what you will want to do with it after. That is a job for another blog.
Happy Planning!