


When I did my application I completely underestimated containers in Tableau. I tried to use them and sometimes they worked really well, but other times they nearly broke me. That’s because I didn’t actually understand how to properly use containers. I am writing this to help you avoid my mistakes (and in case I forget again).
Intro
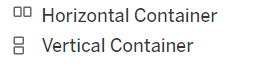
You have built your charts and are now looking to build your dashboard. Great - congrats on the hard part. To make your dashboard visually pleasing and all the charts align, Tableau gives you two little helpers in the objects section: the horizontal container and a vertical container.
These two should become your best friends in this dashboard building process. Fundamentally, containers are transparent boxes that keep the items within them organised. That could be worksheets, textboxes or filters. You can also have containers within containers, which means the inner one gets treated like the other items within. You can arrange and size the items within a container together, meaning they won’t change size independently or move around when you don’t want them to.
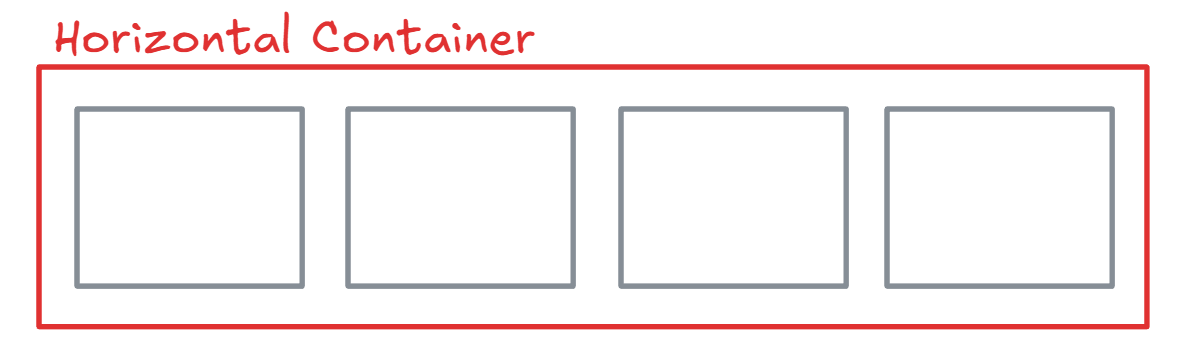
The horizontal container lets you place items next to one another, side-by-side. This means your items are in one single row. The easiest way to imagine this is a row on KPIs along the top of a dashboard.
The vertical container lets you arrange items on top of each other, in a single column.
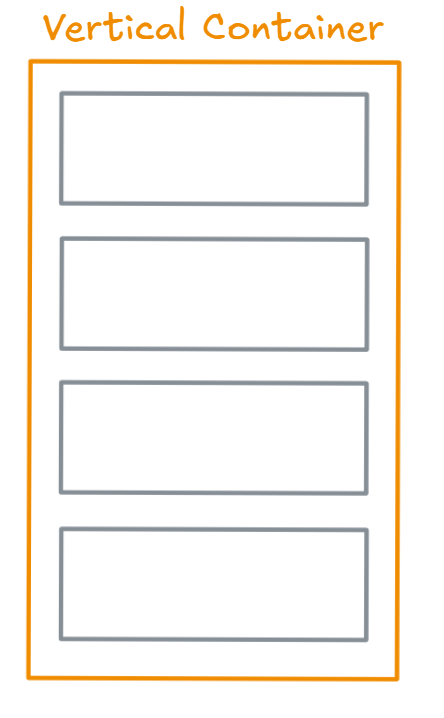
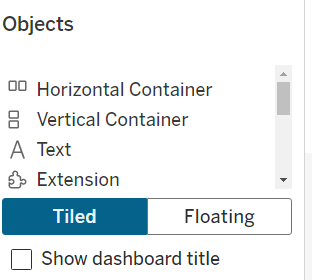
Tableau lets you choose between tiled and floating objects, including containers. But what does that actually mean? Tiled means that your items will sit neatly within an organised structure. They are then sized and positioned automatically, in relation to the layout.
Floating items can be moved around and sized freely, meaning you can place them wherever you want on your dashboard, even over other items. That sounds amazing at first but can cause bad headaches when you upload to Tableau public, view your dashboard on a different screen, or when you have to resize the dashboard.
So: Tiled is the way to go!
Now you understand the difference between a horizontal and a vertical container, and tiled vs floating, let’s get to nesting.
Nesting?
Nesting means you are placing container within containers and are making sure every bit of your dashboard is tiled, so that each worksheet, textbox or other things align. See the example below:
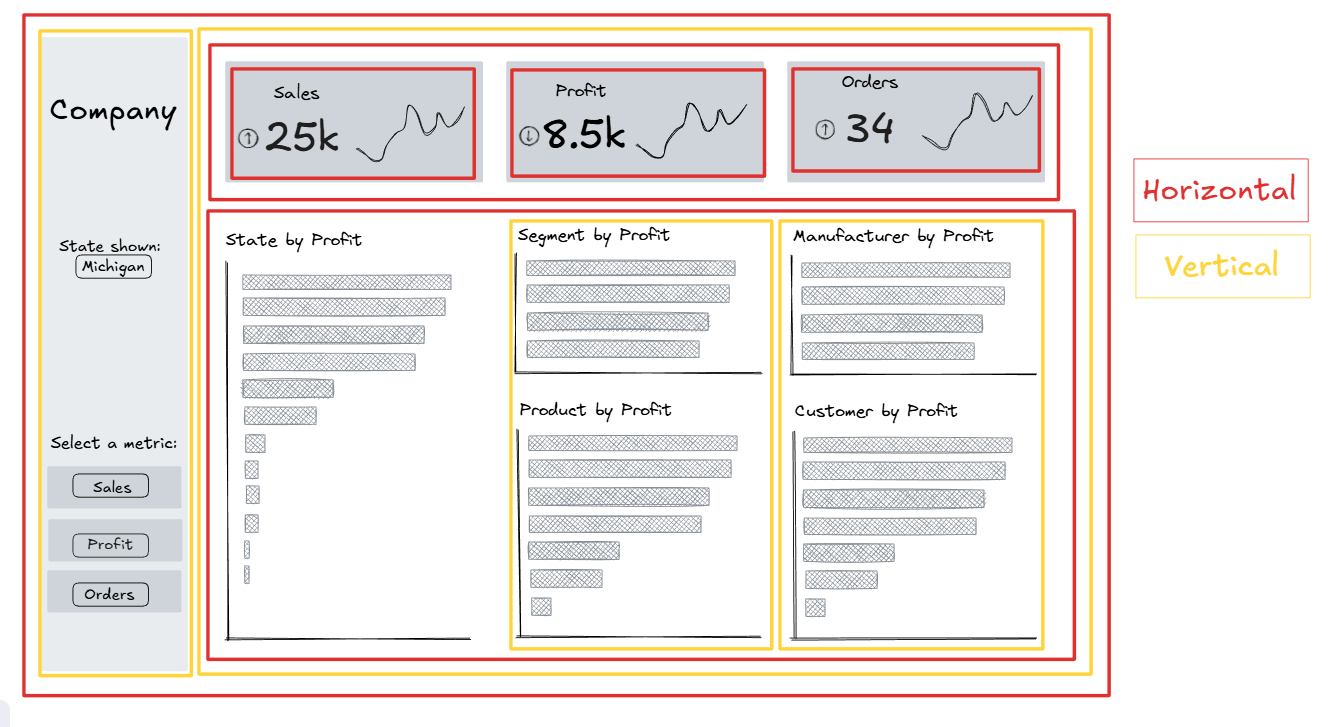
!! One thing to particularly watch out for when building your dashboard layout is to always put at least one blank object in each container immediately. That keeps the container and you won't override it with whatever you drag in afterwards. !!
Enjoy building!