


Bookmarks are a helpful PowerBI feature that capture different states of a report/specific charts. For example, you could use them to create interactivity that lets users flick between two different charts to explore differing data, when you don't need those charts to be side by side and taking up more space. Or, you could use them as a progress tracker, taking bookmarks of a report as you build it, which you could later order and use during a presentation to show how the report evolved over time.
I am going to walk through the basics of how to create and use bookmarks, but there is so much more you can do than what I will cover in today's blog.
Getting Started
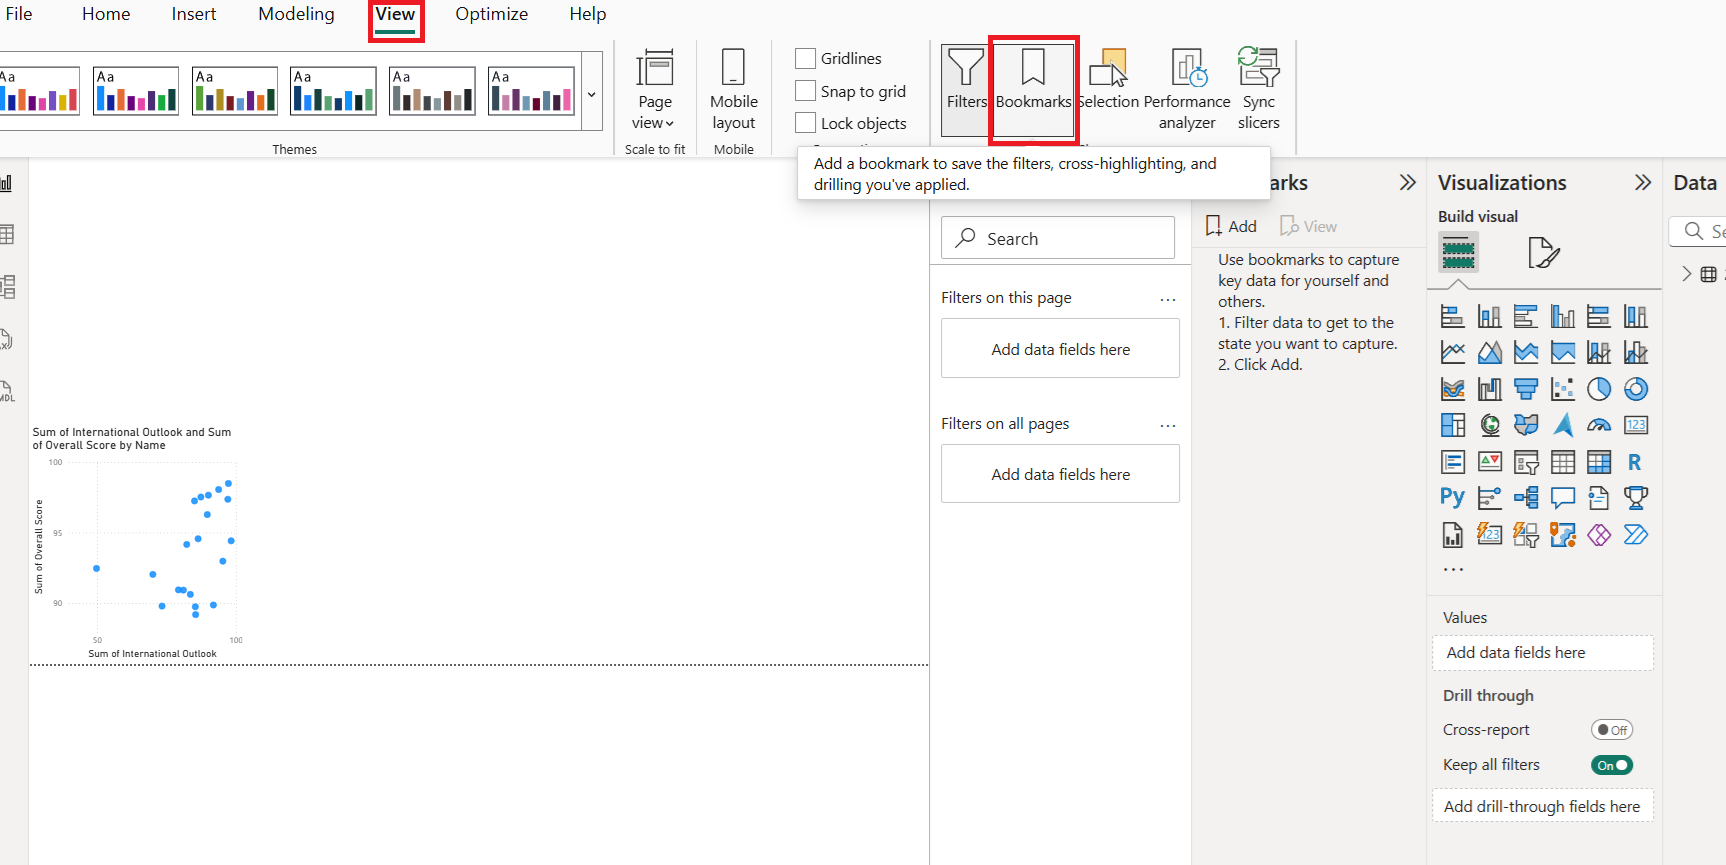
Before starting, make sure the Bookmarks pane is open: View > Bookmarks to access the bookmarks tab on the right-hand side.
Before creating a bookmark, it is important to keep in mind that the following elements are saved with the bookmark:
- The current page
- Filters
- Slicers, including slicer type and slicer state
- Visual selection state e.g. cross-highlight filters
- Sort order
- Drill location
- Visibility of an object
My Example: Chart Toggle
For my example, I am going to use bookmarks to toggle between two charts in the same location. This way, one area of the report can offer different data for users to explore without needing the charts side-by-side taking up extra space. I have also ensured both charts have identical dimensions for a seamless transition when switching between bookmarks.
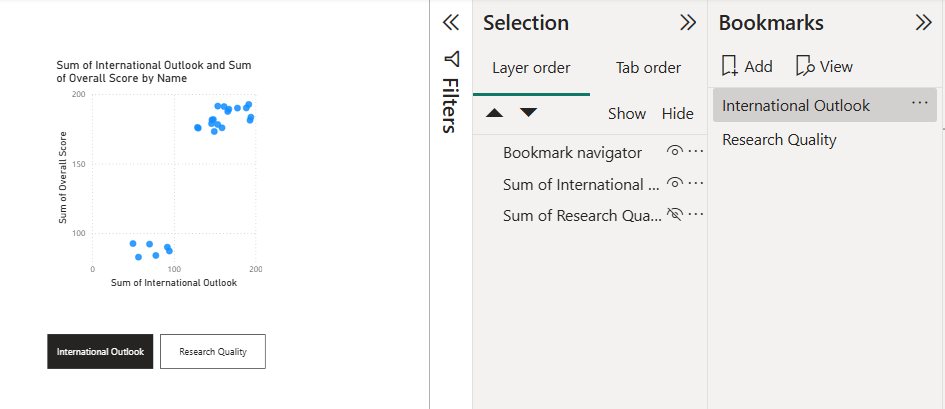
1. Using the Selection Tool to Create Bookmarks
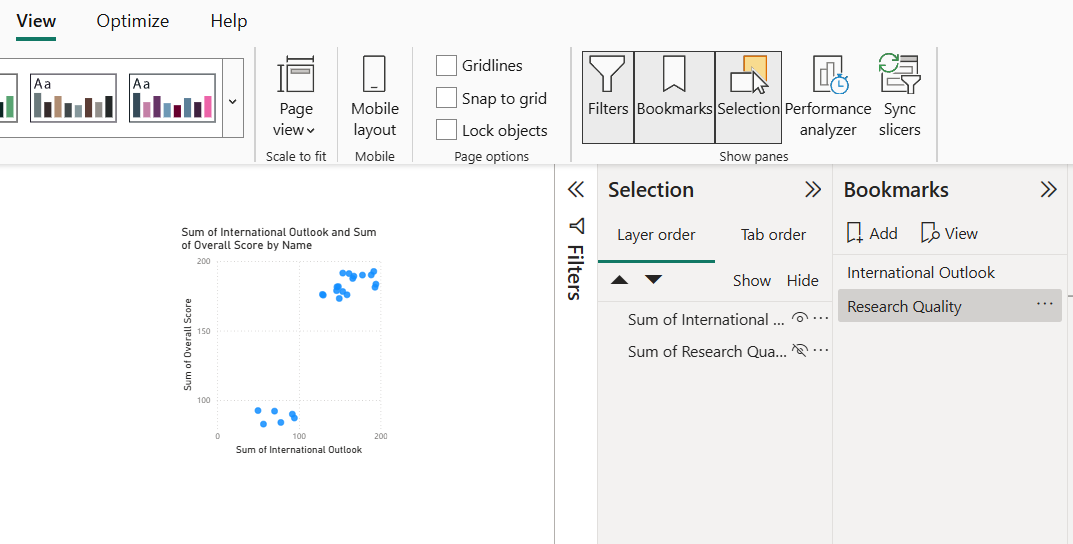
I used the Selection tool (View > Selection) to control which chart is visible and created bookmarks for each view. The bookmark essentially takes a screenshot of what is on your page at that moment, so you set up each view using Selection and then immediately bookmark it.
- Open View > Selection - this shows all objects on your page with eye icons to control visibility
- Hide one chart by clicking its eye icon, keeping only one chart visible
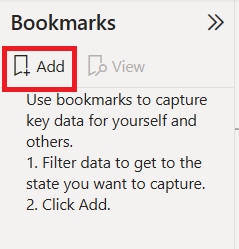
- With your first view set up, go to the Bookmarks pane and click Add to capture this state. Name it something useful to you of what that Bookmark shows. I simply used the names of the charts.
- Now switch to your second view in the Selection pane by hiding the first chart and showing the second chart using the eye icons
- Immediately click Add again in the Bookmarks pane to capture this second view
2. Creating a Navigator Button
Once you have made those bookmarks, you want the user to actually be able to toggle between them. To do so, we will be making a Navigator Button.
- Go to Insert > Buttons > Navigator > Bookmark Navigator to create navigation buttons
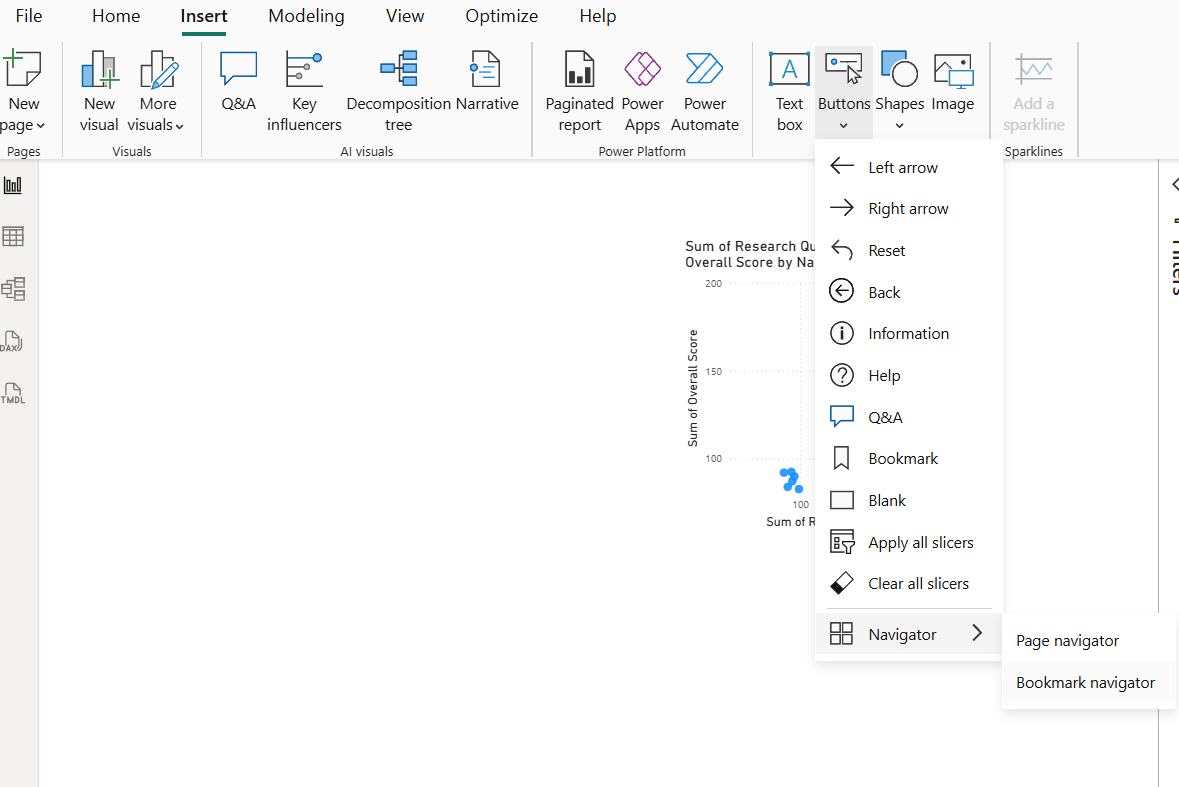
For more complex examples, put bookmarks into groups (right-click bookmark > create group) and configure in button settings: Click button > Format Navigator > Bookmarks > Select group from dropdown
The Result
Now you can click the buttons to toggle between views, and format the button to best fit your report and needs.
Your users can now toggle between different chart views with a single click, providing an interactive way to explore data without cluttering the report with multiple visuals.
Tips
- Consistent sizing: If using it in a similar scenario to mine, keep your charts the same dimensions for smooth transitions between different charts
- Use the Selection pane: This makes it much easier to control visibility of objects
- Test thoroughly: Control+click buttons in edit mode to test functionality
Bookmarks open up many possibilities for creating engaging, interactive reports that tell a compelling data story while keeping your dashboard clean and focused. Happy bookmarking!