


If you come from Power BI, you already know: a Date Table is essential. Without it, you can’t use time intelligence functions like Year-to-Date or Same Period Last Year, and missing months don’t show up.
But in Tableau, things work differently. You don’t need to build a Date Table at all.
1. Continuous Time Axis
When you drag a date field into Tableau, it automatically creates a continuous time axis. Even if your data has gaps (e.g. no sales in March), Tableau still shows March on the chart. In Power BI, you would need scaffolding with a Date Table for that.
2. Built-in Date Hierarchies
Tableau recognizes date hierarchies by default: Year → Quarter → Month → Week → Day.
You can drill up and down in a single click, without building extra columns or relationships.
3. Time Calculations Made Easy
Running totals, moving averages, year-over-year growth – in Tableau, these are available as Quick Table Calculations. You don’t need DAX or a marked Date Table, because Tableau can calculate directly on the time axis.
4. Comparison with Power BI
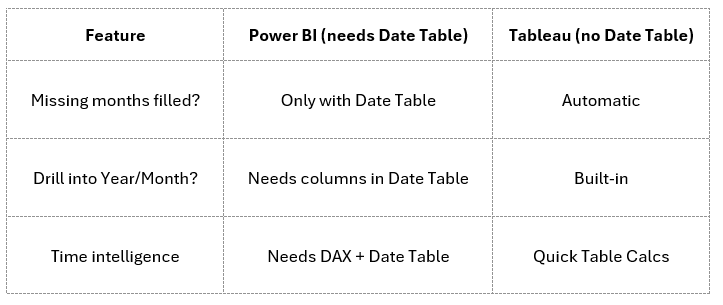
✨ Conclusion
In Power BI, a Date Table is the backbone of any time-based model. In Tableau, the date handling is already built in – the tool acts as if a Date Table exists behind the scenes.
That’s why, when working in Tableau, you can spend less time building scaffolding tables and more time exploring your data.