


Welcome to the second day of Dashboard Week, where every day I explore something new and create a dashboard about it 🏃➡️
Today I was working with Advanced Data Modeling in Power BI and found out that role-playing dimensions are as useful, as complicated they sound. Let me explain!
Definition
A table with multiple relationships between itself and another table is known as a role-playing dimension.
- A role-playing dimension can filter related values differently
- Same dimension can be used in a Fact table multiple times, each time having a different meaning
Most often this term is used for datasets with a few dates, as I have in this flower store purchase dataset:
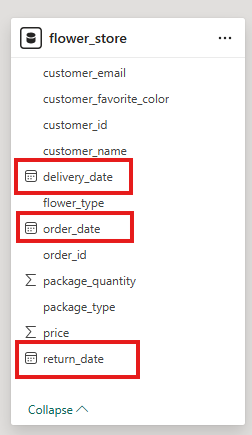
For each order we have an Order and Delivery Date, if the order was returned there is a Return Date. Seems like we can already work with it, but unfortunately it's not that easy.
Problem with dates
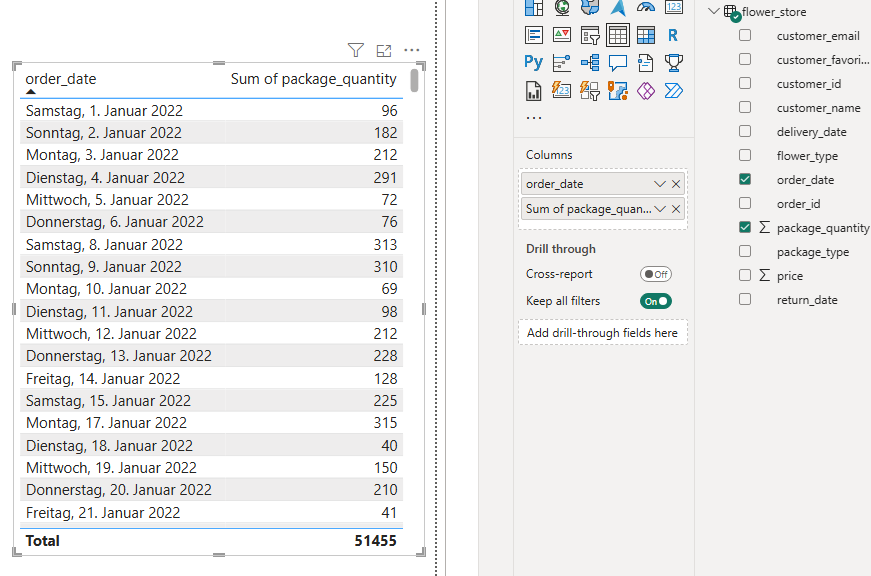
For example, we can't analyse how many bouquets were sold per month using just order date and quantity, we need further calculations.
To solve it, we will create a calendar table.
Calendar Table
To create a star schema, we'll create a dimension table, containing all the dates in dataset using DAX expression.
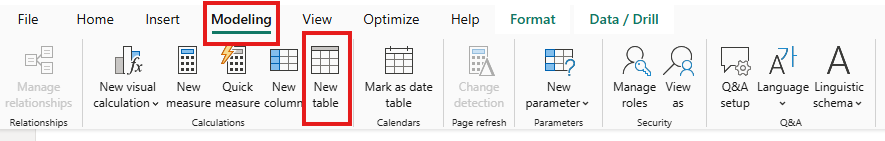
Create a table
- At first go to Modeling -> New Table
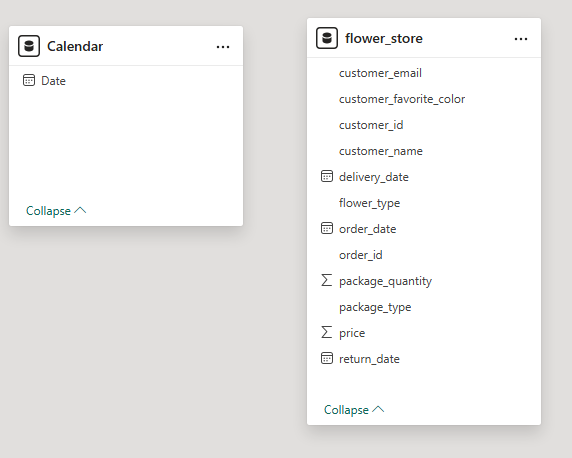
- Use DAX function: Calendar = CALENDARAUTO()
New table will automatically appear in Model View:
Define Relationships
Let's set connections between all date fields in the fact table and Date in calendar.
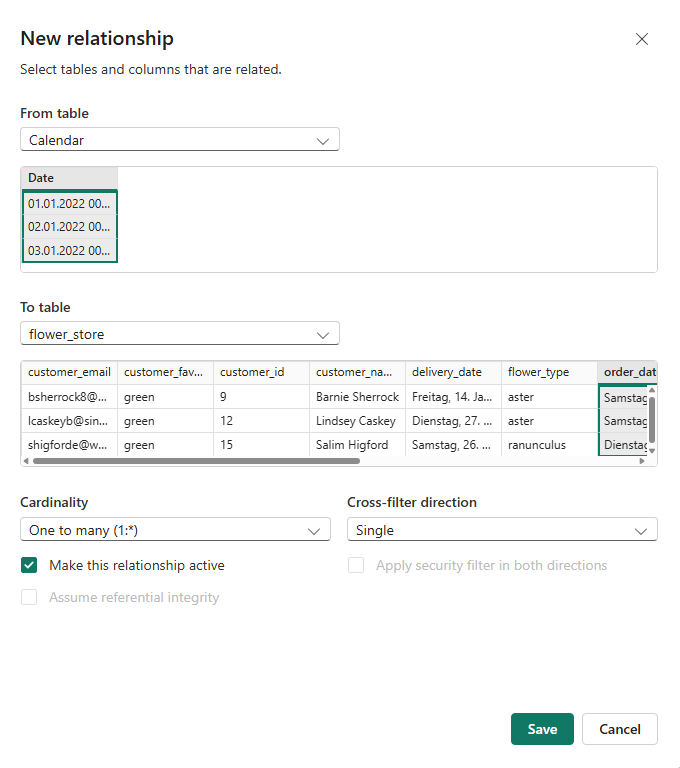
Active and Inactive Relationships
This is the result we have:
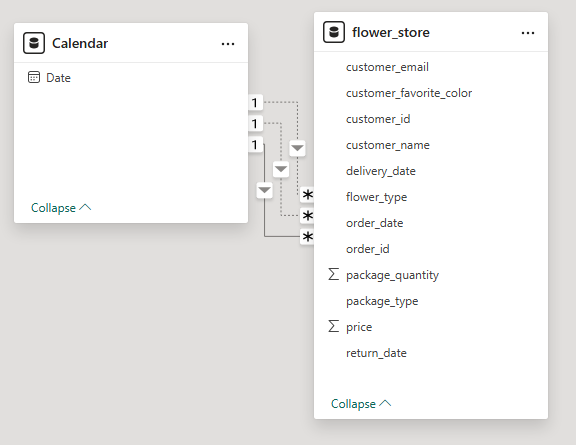
There are three connections, but only one can be active at a time due to Power BI architecture. Active relationship is shown as a bold line.
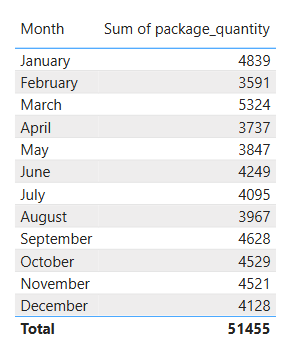
We can already use this table and without any calculations see how many bouqets were sold in each month:
However, to see number of returned or delivered flowers, we have to go back to Model View and change connection manually. And the sadest part is that we can't work with these values at the same time to compare them. But there is a function that can help us...
USERELATIONSHIP() function
This function acts as a filter that determines which connection should be activated in each case. We will use it in combination with the CALCULATE() function, which defines the calculation and the filter to be applied.
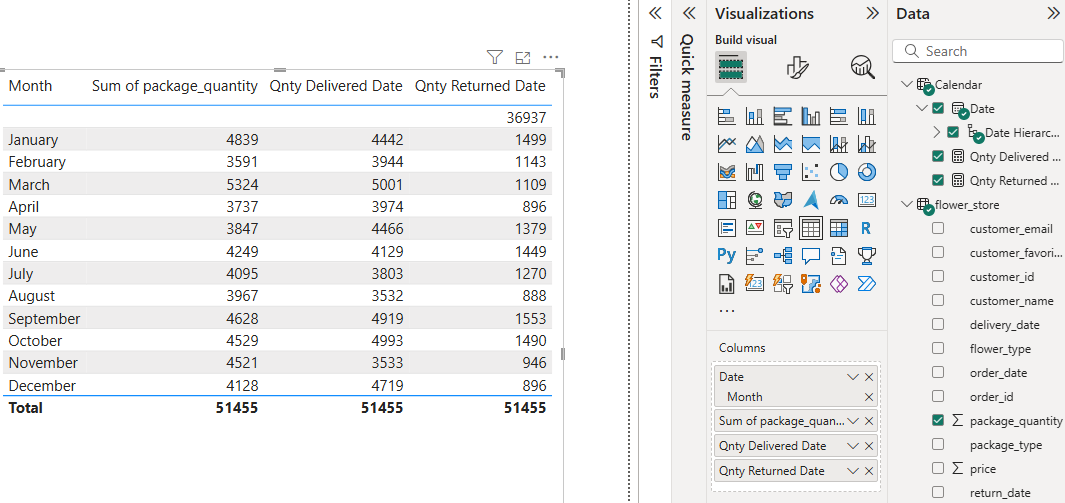
We'll create two measures in Calendar Table:
Quantity of delivered flowers:
Qnty Delivered Date = CALCULATE(sum(flower_store[package_quantity]), USERELATIONSHIP('Calendar'[Date], flower_store[delivery_date]))
And Quantity of returned flowers:
Qnty Returned Date = CALCULATE(SUM(flower_store[package_quantity]), USERELATIONSHIP('Calendar'[Date], flower_store[return_date]))
These calculations allow us to use an inactive connection, so we don't have to set up an active connection manually.
And here is final result:
You can find the whole workbook here: https://app.powerbi.com/view?r=eyJrIjoiNDhmMjE0MjItZjkxOC00NTQwLWEzYjItYTI1MzJhYjQ5YWQwIiwidCI6IjgwODkxMjkwLTlkZTMtNGJiOC1iMWEzLThhYTg0NGVkZTk2MyIsImMiOjh9
Thanks for reading, I hope it was useful 🤗
See you in the next post!