


For our second day of Dashboard week we were tasked with recreating a chosen dashboard from the list on this post - with one particular catch, we had to recreate it in PowerBI.
The dashboard I was recreating today was this super cool Tableau dashboard (also see below) originally created by our coach, Robbin.
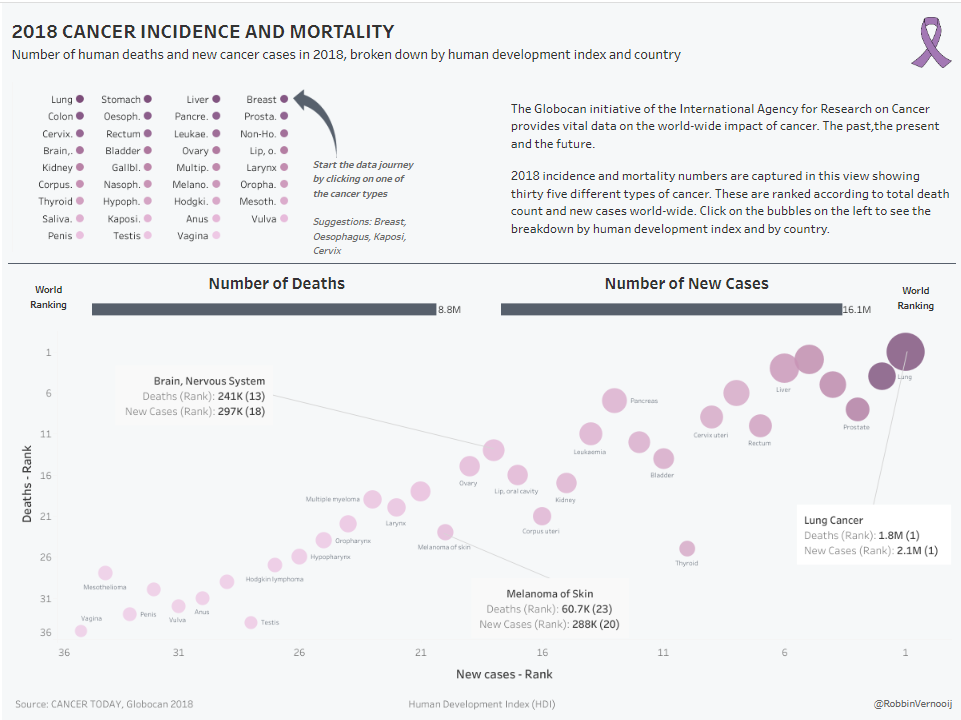
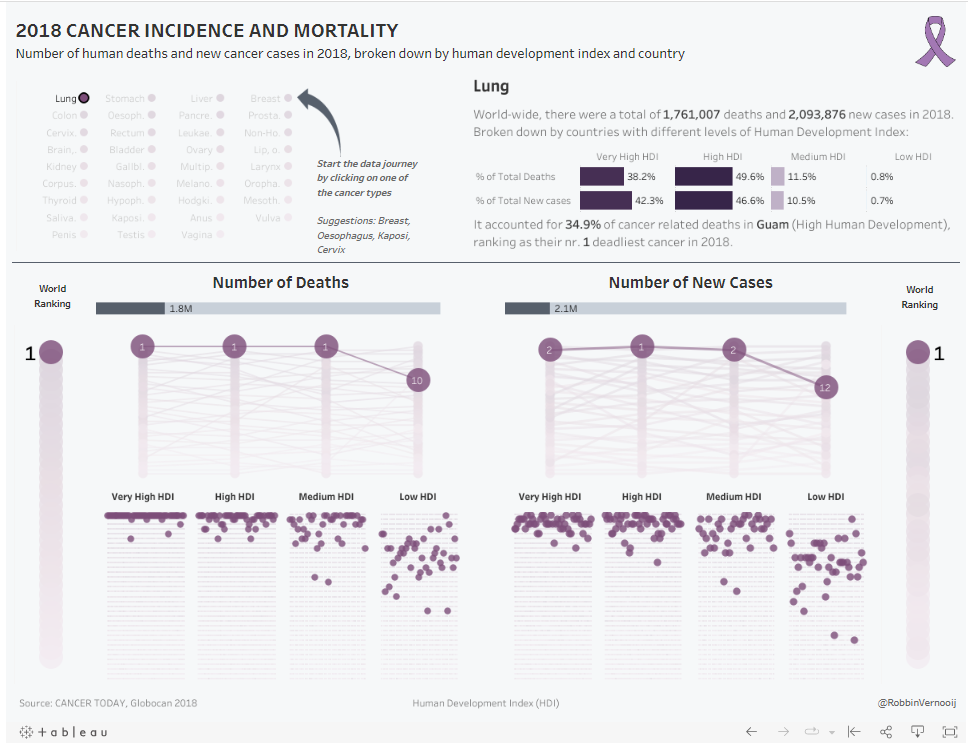
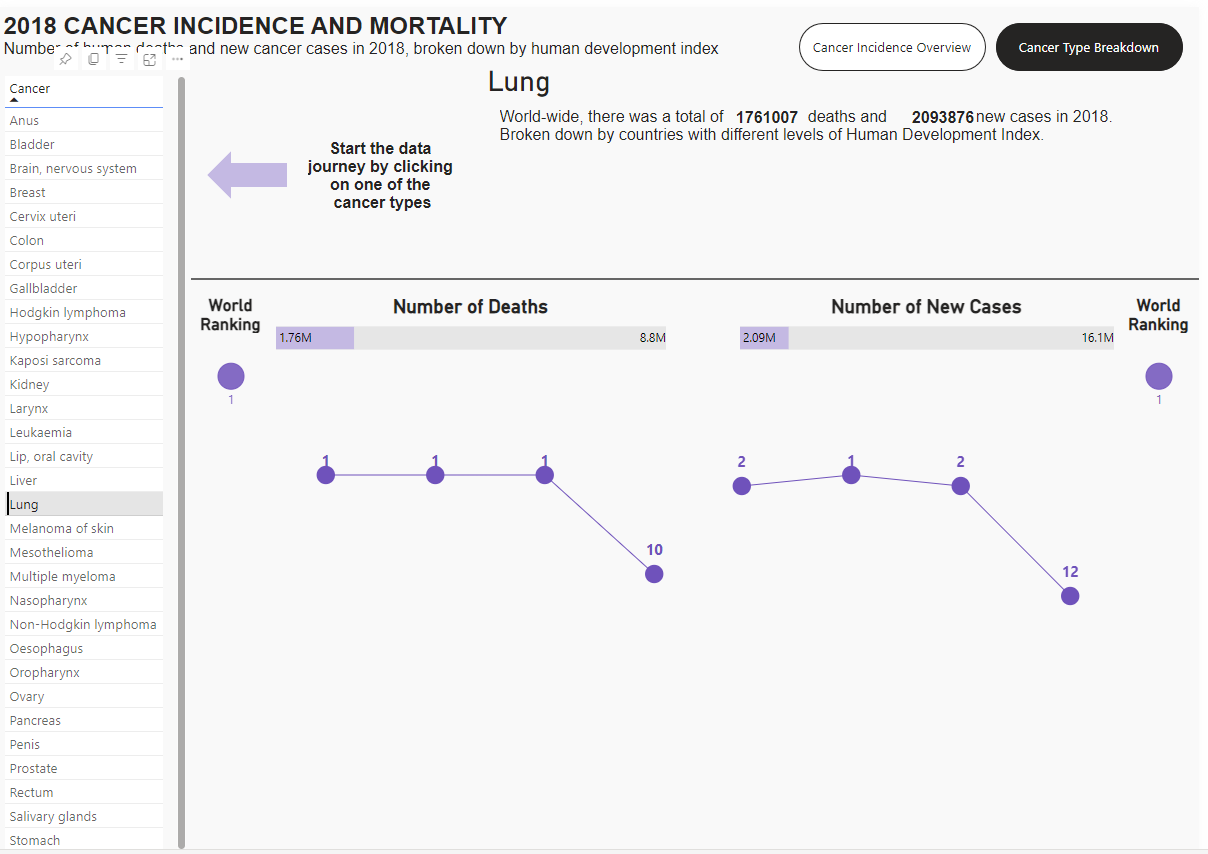
This dashboard has a lot of cool dynamic actions going on behind the scenes, including some dynamic zone visibility as well as some hacky charts. As an example - here is what shows up once you select a dot for a particular cancer type.
My plan for the day began with dissecting the original dashboards down to their core components. From here, I then prioritised which charts I wanted to include in my PowerBI recreation, as I only had one day to complete this recreation, with minimal PowerBI experience, and I knew I would not be able to include everything. To be completely honest - I feel like this kind of dashboard would take me a while to recreate in Tableau, let alone PowerBI, so I was happy to continue working on a more rough recreation where I try to maintain the core components and story lines instead of beating myself up trying to get everything done.
All in all, it was definitely interesting learning PowerBI while essentially on the job, as there were a lot of new features to get to grips with and I had to learn how to create charts using methods I am not yet used to.
Here is how my final PowerBI dashboard turned out:
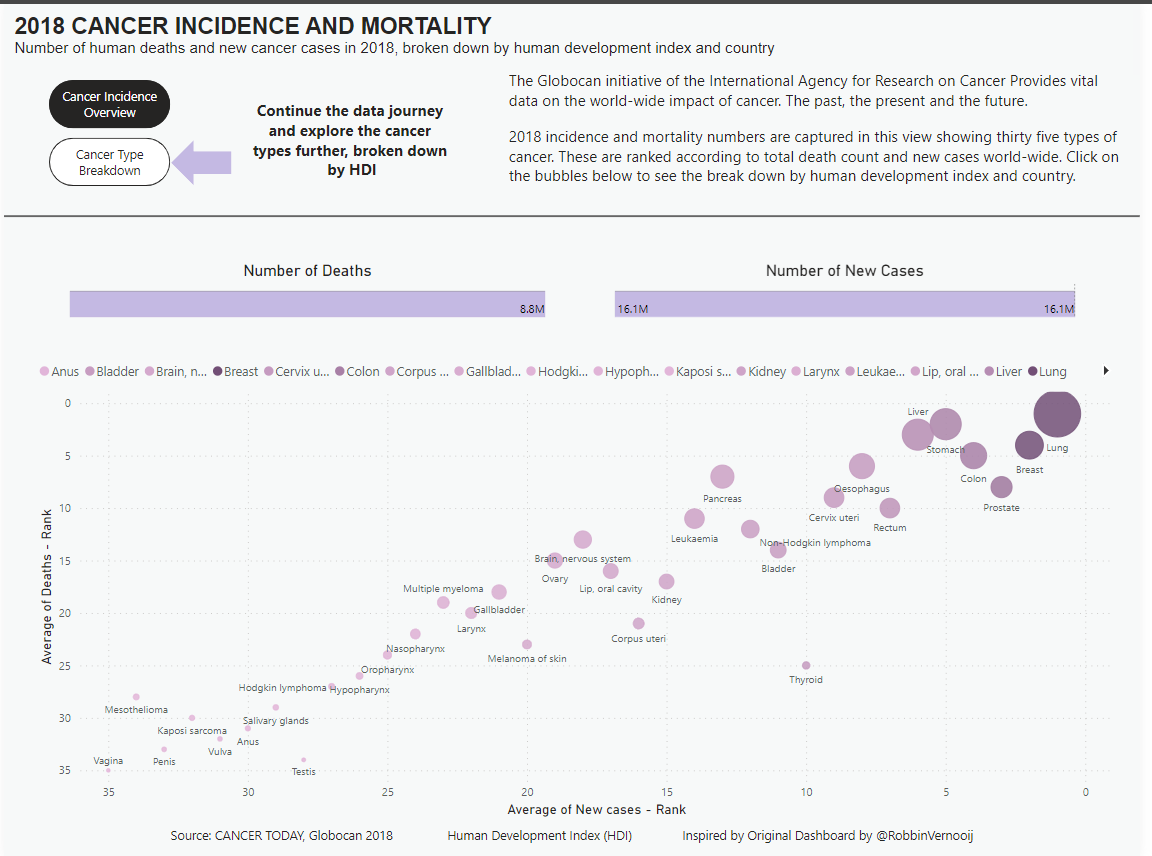
I think I was able to maintain a lot of the key aspects of the chart, although there are definitely aspects that I would have liked to include that I didn't end up including in the final dashboard but as I had a limited amount of time these included some of the more intricate charts that involved things like index calculations, as well as some of the smaller charts in the report.
While I was slightly disappointed that I couldn't include all the cool original functionality from the original Tableau dashboard, I am pretty happy with how much I was able to learn about PowerBI.